

A new plan displays the long term forecast data when creating the plan.
-
the long-term forecast data for a single WEM Skill
-
Click the WEM Skill icon
 and select a WEM Skill from the drop-down list to display plan data for an individual WEM Skill in the plan.
When creating a plan, you select the Scheduling Units for the plan. You can see and change the staffing parameters at the Scheduling Unit level. The Scheduling Unit to WEM Skill staffing distribution updates the WEM Skills associated with the Scheduling Units.
If you add new hire classes to the plan, the plan also accounts for the time new agents need to become fully productive.
 All WEM Skill
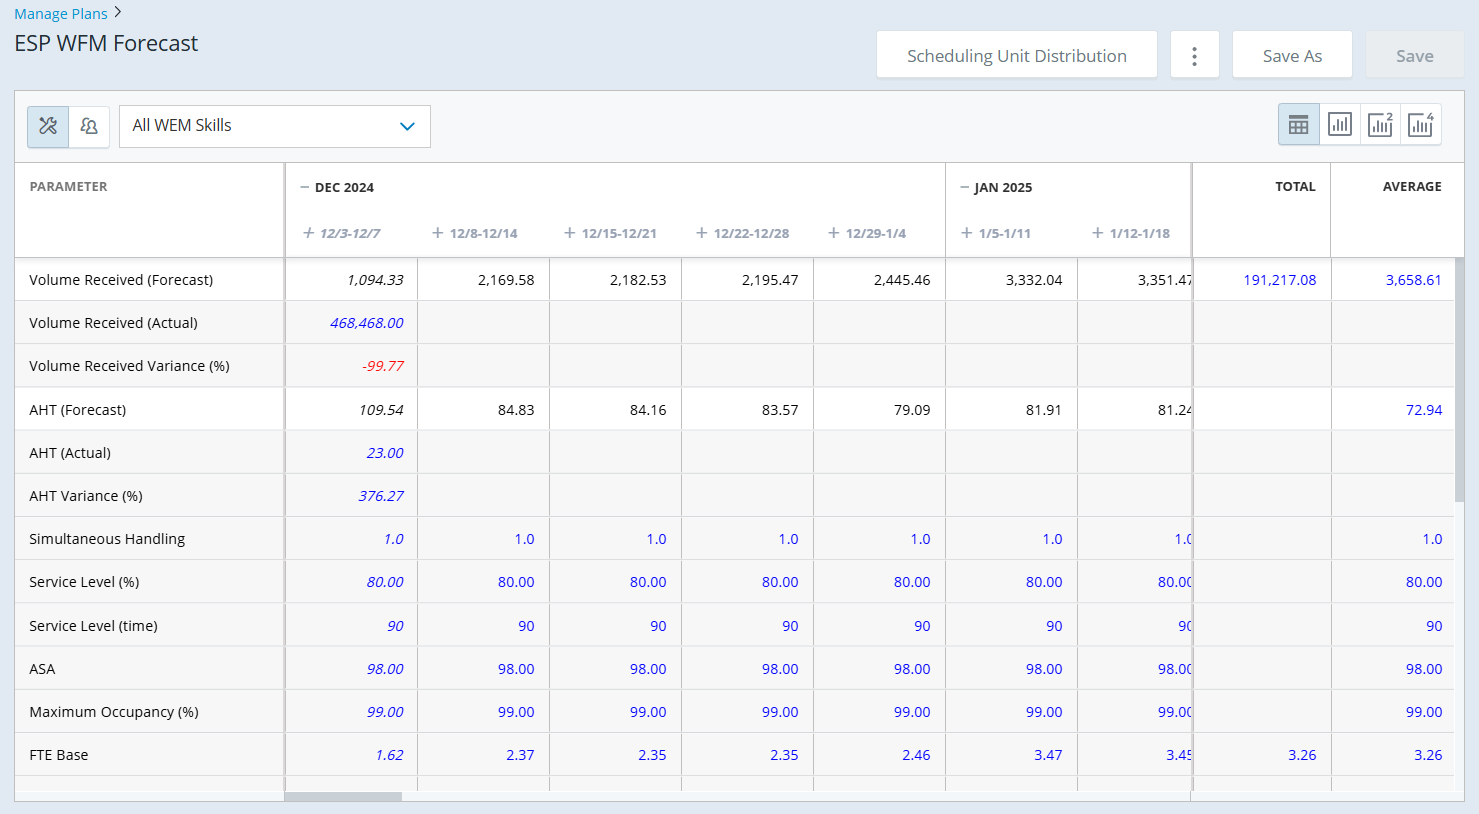
|
Plan Page Item |
Description |
Refer To |
|---|---|---|
| Scheduling Unit Distribution | Add or change the staffing distribution percent for each Scheduling Unit to WEM Skill association in the plan. | Add or Change Scheduling Unit to WEM Skill Staffing Distribution |
|
Options ( |
Export the plan as CSV file, export the plan as an Excel file, import plan data from an Excel file, change plan WEM Skill settings, change plan settings, manage new hire learning curves and classes. |
|
|
Save As |
Save the plan as a new plan. |
|
|
Save |
Save updates to the plan. |
|
|
WEM Skill Scheduling Unit |
The entity for which you are viewing plan data. |
|
|
Chart ( |
Chart the plan data. |
|
|
Plan data |
Plan parameters in a day, week, or month interval. |
 ,
 ,
 )
New Hire Training Class
New Hire Learning Curve Parameters
When you add new hire classes to a plan, the plan calculates how much the new hires contribute in each week of their training. New hire classes contribute to every WEM Skill in the plan. They change these values:
-
Projected Service Level (%), Projected ASA, and Projected Occupancy (%) use AHT (Forecast) and FTE Actual Total, so they reflect agents who are still ramping up.
-
AHT (Forecast) is calculated from AHT (Productive) and AHT (New Hire). FTE Base and FTE Required use it.
-
FTE Required +/- uses FTE Actual Total to show overstaffing and understaffing.
-
FTE Actual Cost uses FTE Total. New hire cost starts on the class start date.
The plan calculates AHT (New Hire), AHT (Forecast), FTE Actual New Hire, FTE Actual Total, FTE New Hire, and FTE Total. You cannot edit these values in the plan. To change them, edit the learning curve or class.
New Hire Learning Curves
New hire learning curves let you plan for the time new agents need to become fully productive. A learning curve describes how new hires perform in each week of their training. You add new hire classes to the Scheduling Units in the plan, and the plan uses them to calculate staffing, handle time, and cost for every WEM Skill in the plan.
You do not need new permissions. With modify permission for the Enhanced Strategic Planner application and the plan entity, you can add, edit, delete, apply, and export learning curves and classes. With view only permission, you can see them but not change them.
How New Hire Learning Curves Work
A learning curve covers a training period of up to 26 weeks, including classroom training and nesting. For each week, you set:
-
AHT: the average handle time, in seconds, that new hires take per volume.
-
% Productive: the percentage of FTE hours that new hires spend handling interactions.
-
Working days: the days new hires handle interactions.
A class is a group of new hires who start on the same date in the same Scheduling Unit. Each class uses one learning curve. A learning curve can have multiple classes.
Productive time is a percentage of the plan FTE hours, even if the training schedule is shorter. It does not reduce the handle time. For example, a class of 20 new hires at 10% productive time in a 40-hour FTE week adds 2 FTE of interaction handling that week. When the class ends, its new hires count as fully productive agents in FTE Actual.
New hire classes affect the plan in these ways:
-
Every class contributes to every WEM Skill in the plan. The plan splits each Scheduling Unit's new hire values across its WEM Skills using the Scheduling Unit to WEM Skill distribution.
-
AHT (Forecast) is calculated from the handle time of productive agents and new hires. When there is no new hire data, it equals AHT (Productive). The plan uses AHT (Forecast) for FTE Base, FTE Required, and the projected service level, ASA, and occupancy.
-
FTE Actual Total is FTE Actual plus the productive share of new hires. The plan uses it for FTE Required +/- and the projections.
-
FTE Total includes every agent, including new hires still in training. The plan uses it for FTE Actual Cost, which starts on the class start date.
Note: If a plan used a new hire training period before, the plan converts it to a learning curve the first time you open the plan.
Add a Learning Curve
To add a learning curve:
-
On the plan details page, click Options
 , and select New Hire Training Class.
This option is not available while the plan has unapplied changes.
-
Click Add Learning Curve.
-
Enter the Name.
All WEM Skills in the plan are selected for the learning curve. You cannot clear them.
-
Enter Class training weeks (enter a whole number from 0 to 26) and click Update Weeks. The default is 4.
-
For each training week, enter:
-
AHT (seconds): 0.00 to 99999.99, or blank.
-
% Productive: 0.00 to 100.00, or blank.
% Productive is the percentage of the configured FTE hours spent processing contacts.
You can enter 0% for weeks spent entirely in training.
-
-
Select the Working Days on which new hires process contacts. To use the same days for every week, click Apply to All Weeks.
-
Click Save.
The learning curve appears on the New Hire Training Class page. Create the required classes, apply the changes, and save the plan.
Add a New Hire Class
To add a new hire class:
-
On the New Hire Training Class page, on the learning curve row, click Add Class.
-
In the Add New Hire Classes window, select one or more Scheduling Units.
-
In FTE Count, enter the number of new hires.
Valid values are 0 to 99999.99.
-
Select a Starting Date or Ending Date.
The plan calculates the other date using the learning curve’s training weeks.
-
The class must start and end within the plan date range.
-
The starting date must use the plan’s start day of week.
-
Partial training weeks cannot be selected.
-
For a zero-week learning curve, the starting and ending dates are the same.
-
-
Click Save.
The class appears under its learning curve.
-
Click Apply.
This applies the learning curves and classes to the plan and recalculates the affected values.
-
Click Return to Plan.
-
Click Save or Save As.
Saving a learning curve or class does not recalculate the plan. Click Apply to recalculate the plan with all your changes. Apply runs in the background and shows its progress.
Note: Apply does not save the plan. After you apply, click Return to Plan and click Save or Save As. If you close the plan without saving, your applied changes are lost.
-
To undo changes you have not applied, click Discard Changes. The page returns to the last applied values.
-
If you leave the page before you click Apply, a message warns you, and the unapplied changes are discarded.
-
To return to the plan, click Return to Plan
-
Edit a Learning Curve or Class
To edit a learning curve:
-
Click the learning curve name.
-
Change the required weekly AHT, productive percentage, or working days.
-
Click Save.
-
Click Apply, then Return to Plan.
-
Click Save or Save As on the plan page.
You cannot change the training duration while the learning curve has associated classes. To use a different duration, create another learning curve. If the curve has no classes, its duration can be changed. Changes to an existing curve affect its associated classes when applied.
To edit a class:
-
Click the class name.
-
Change FTE Count, Starting Date, or Ending Date.
-
The Scheduling Unit is read-only.
-
Click Save.
-
Click Apply, then Return to Plan.
-
Click Save or Save As on the plan page.
Delete or Discard New Hire Changes
To delete a class, click its delete icon and confirm. To delete a learning curve, click the learning curve name, click Delete, and confirm. Deleting a learning curve also deletes its associated classes. Review the confirmation before continuing. After deleting, click Apply, return to the plan, and save the plan to retain the changes.
To undo changes made since the last Apply, click Discard Changes. This does not undo changes already applied. To discard applied but unsaved changes, close the plan without saving and reopen it.
Chart New Hire Data
To chart new hire data:
-
Open the plan, click Scheduling Unit, and select one or more Scheduling Units.
-
Click the icon for the number of charts you want to see.
-
Click Show parameters, and select FTE Actual and FTE Actual New Hire.
The chart shows productive and new hire FTE for each week.
You cannot drag new hire values in a chart, because the plan calculates them. In the WEM Skill view, you can drag AHT (Productive).
Export New Hire Class Data
On the New Hire Training Class page, select the required Scheduling Units and click Export as CSV. Export as CSV is not available when the plan has no classes.
Exporting Plan Data as CSV
Click Options and select Export as CSV to export the plan data you are viewing to a CSV file. The exported data is based on the WEM Skill or Scheduling Unit drop-down selection:
-
one or more Scheduling Units
-
a single WEM Skill
-
All WEM Skills
Click Options and select Export Every WEM Skill to export the plan data for each WEM Skill in the plan to a CSV file.
When the WEM Skill distribution calculation method is Use WEM Skill FTE required and there are unapplied changes in the WEM Skill or All WEM Skills plan details page, the export options are not available. When there are unapplied changes in the Scheduling Unit plan details page, the Export Every WEM Skill option is not available.
The new hire training period does not appear in the exported file.
The CSV file includes:
-
the first row displays the plan name, exported by username, and the export date and time
-
For Export Every WEM Skill, the first row displays only the plan name
-
WEM Skill column with the name of the WEM Skill, if you selected to export every WEM Skill
-
Scheduling Unit column with Plan rollup or name of the Scheduling Units, if you selected to export Scheduling Unit data
-
plan column headings:
-
Parameter
-
the day, week, or month interval heading based on the interval displayed when you exported
-
Total
-
Average
-
-
plan data
Exporting and Importing Plan Data in Excel
You can export plan data to an Excel workbook to review the data, share it, or change editable parameter values outside Enhanced Strategic Planner. You can then import the updated workbook into the plan without generating another long-term forecast.
The export uses the current WEM Skill or Scheduling Unit selection and date interval. Values in blue text are calculated. If you change a calculated value in Excel, the plan ignores the change when you import the file. The file retains formatting that helps identify the plan values:
-
White background - Editable cell
-
Gray background - Read-only cell
-
Blue text - Calculated value
-
Orange text - Capped value
-
Red text - Negative value
-
Diagonal gray lines - Closed day
-
Italic text - Partial interval
You can import an updated Excel to change editable plan values in bulk. Enhanced Strategic Planner validates the file before applying the values to the grid. Imported values then use the same validation and calculation processes as values entered directly in the plan.
You can export and import plan data only on the WEM Skill and Scheduling Unit pages. You must have modify permission for the plan to import plan data. With view-only permission, you can export plan data, but Import from XLSX is not available.
To export plan data to an Excel file:
-
Open a plan from the Manage Plans page.
-
Click WEM Skill or Scheduling Unit and select the WEM Skill, All WEM Skills, or the Scheduling Units you want to export.
-
Change to the date interval you want to export (month, week, or day).
The file uses the interval displayed in the plan. You must import the file in the same interval.
-
If there are unapplied changes on the page, click Apply.
Export as XLSX is not available while the Scheduling Unit page has unapplied changes. It is also not available on the WEM Skill page when the WEM Skill distribution calculation method is Use WEM Skill FTE required and there are unapplied changes.
-
Click Options
and select Exportas XLSX.The Excel file downloads to your computer. The file name identifies the plan, WEM Skill or Scheduling Unit view, entity selection, and interval. The Plan Data worksheet includes:
-
plan name
-
exported by username
-
export date and time
-
date interval
-
view type
-
plan column headings and data
Edit the plan data in Excel
You can change editable input values in the exported file. For example, you can adjust forecast contacts received, productive AHT, mean concurrency, service level objectives, or shrinkage where those parameters are editable in the selected view and interval. The same parameter restrictions and valid-value rules apply as when editing the plan directly.
-
Change only cells with white background.
-
Do not change the first row. The import uses it to check the interval and view.
-
Do not add, delete, or move rows or columns. The file must have the same number of rows and columns as the plan page.
-
Keep the data on the first worksheet. The import reads only the first worksheet.
-
Changes to calculated, capped, read-only, locked, or closed-day cells do not override those values in the plan.
-
To clear a value, change it on the plan page instead. The import skips blank cells, so a blank cell does not clear a value.
-
You can rename the file. Save it as an Excel workbook (.xlsx).
-
To import plan data from Excel:
-
Open the plan you exported the data from.
-
Click WEM Skill or Scheduling Unit and select the same WEM Skill, All WEM Skills, or Scheduling Units used when exporting the file.
-
Change to the same date interval used for the export.
-
If there are unapplied changes on the page, click Apply. Correct any invalid values in the current grid.
Import from XLSX is not available while the page has unapplied changes or invalid values.
-
Click Options
and select Import from XLSX. -
Select the Excel file and click Open.
The plan checks the file before it changes any values. If the file type, interval, view, or number of rows and columns does not match, the plan does not import the file.
-
Review the imported values in the plan.
Only editable cells are updated. Changes to calculated or read-only cells are ignored, and dependent values are recalculated through the normal plan calculation process.
-
Correct any highlighted invalid values. Click an invalid cell and review its error information. Enter a valid value for the parameter.
Until you fix every invalid value, you cannot apply or save the plan.
-
To undo the import instead, click Reset to last valid plan.
-
Click Apply.
-
To save your changes to the plan, click Save or Save As.
The import does not save the plan. If you close the plan without saving, the imported values are lost.
After you import the file, the plan recalculates the values that depend on the values you changed. You can keep editing the plan as usual, including copying and pasting and dragging chart points.
Note: Import the workbook into the same plan, WEM Skill or Scheduling Unit selection, and date interval used for the export. The workbook must have the same number of rows and columns as the current grid.
For example, a workbook exported in the week interval cannot be imported while the plan displays the month interval.
Saving a Plan as a New Plan
You must have modify permission to a plan to save it as a new plan.
To save a plan as a new plan:
-
Click Save As on the plan page.
-
In the Save As window, enter the unique Plan Name.
This field allows limited special characters (-, (, ), <, >, #, :, ;, blank). The first and last character cannot be a special character.
-
Click Save.
This saves the plan settings and plan data. The plan data includes All WEM Skills, WEM Skill, Scheduling Unit, and Scheduling Unit to WEM Skill distribution data.
Large plans that take a while to save appear in gray text at the top of the Manage Plans page with PENDING in the Modified Date field. For these plans, refresh the Manage Plans page until the plan is no longer pending.
If the Modified Date of the plan is FAILED, the plan could not be saved. If saving the plan continues to fail, contact your system administrator.
-
Click on the new plan to open it.
WEM Skill or Scheduling Unit View
The WEM Skill view is the default view when opening a plan.
To view or edit plan data for a single WEM Skill or all WEM Skills in the plan, click WEM Skill. The drop-down list contains:
-
All WEM Skills
See plan data totals for all WEM Skills in the plan. This option does not appear for a single WEM Skill plans. This is the default selection.
The WEM Skills are in ascending order.
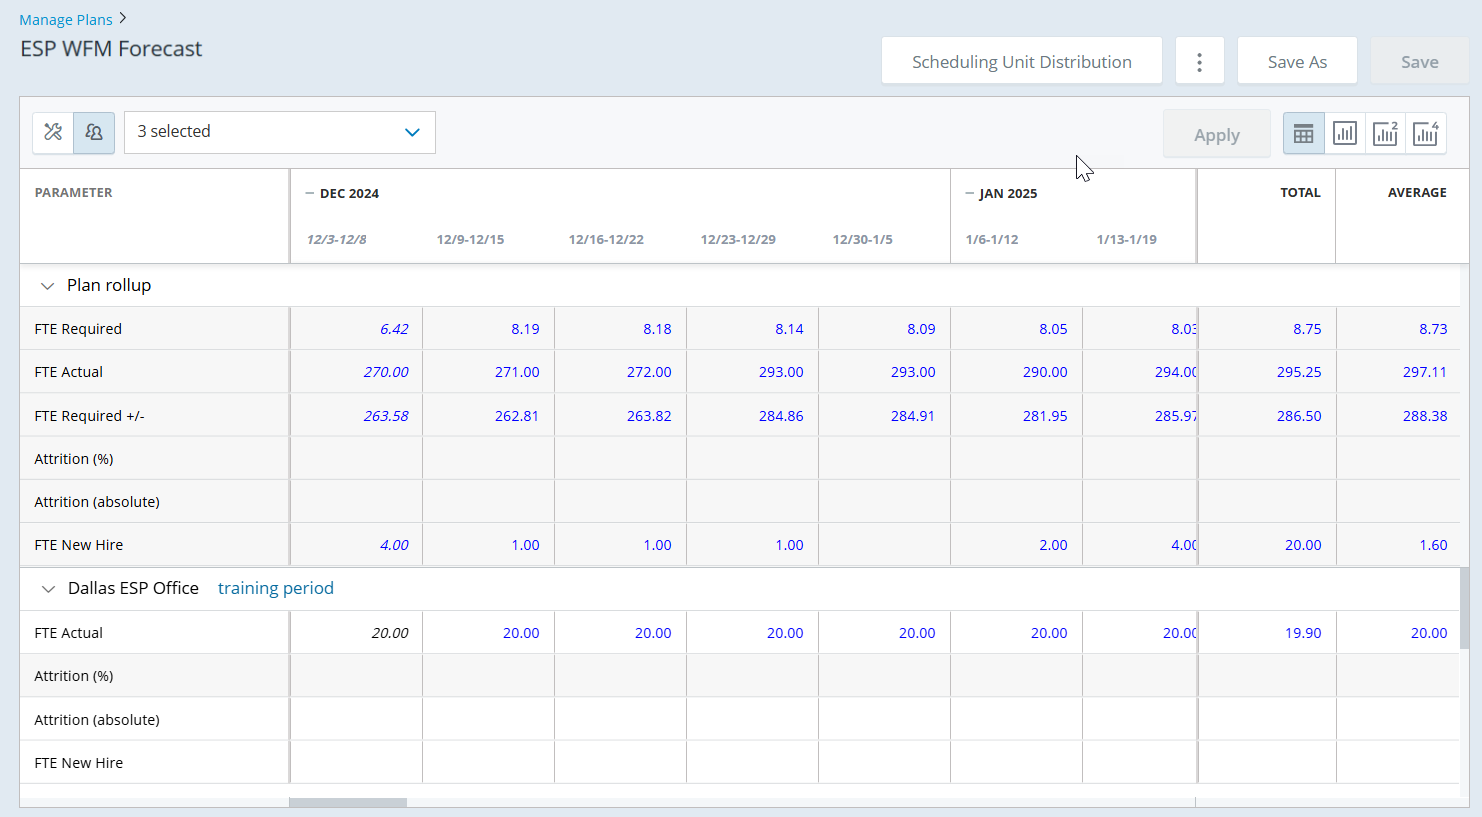
To view or edit plan data for one or more Scheduling Units in the plan, click Scheduling Unit. The drop-down list contains the plan Scheduling Units.. The Scheduling Units are in ascending order. The default selection is the first Scheduling Unit in the list. Your Scheduling Unit selections for up to the last 10 plans you open will be your new defaults, until you change them or clear your browser's cache.
Plan Spreadsheet Rows and Columns
In the plan spreadsheet:
-
Rows with a gray background are read-only.
-
A value in black text is a user-entered value. A value in blue text is a calculated value.
-
When you hover over a parameter name or column header (other than the date header), a tooltip displays the full name.
-
If the plan forecast was an imported forecast, the dates missing from the forecast appear with blank data.
In the Scheduling Unit view:
-
Plan rollup group heading, under the grid column headers, displays the total of these FTE staffing parameters for all Scheduling Units in the plan:
-
FTE Required
-
FTE Actual Total
-
FTE Required +/-
-
Attrition (%)
-
Attrition (absolute)
-
FTE New Hire
-
FTE Total
-
-
Under the plan rollup is the data for the selected Scheduling Units. You can collapse or expand this data. If a plan used a new hire training period before, the plan converts it to a learning curve the first time you open the plan.
List of the parameters and where you see them:
|
Parameter |
Appears for This WEM Skill or Scheduling Unit View |
Appears in This Interval? |
|---|---|---|
|
Volume Received (Forecast) |
All WEM Skills, WEM Skill |
Day, Week, Month |
|
Volume Received (Actual) |
All WEM Skills, WEM Skill |
Day, Week, Month |
|
Volume Received Variance (%) |
All WEM Skills, WEM Skill |
Day, Week, Month |
|
Volume Handled* |
All WEM Skills, WEM Skill |
Day, Week, Month |
|
Actual FTE Capacity* |
All WEM Skills, WEM Skill |
Week, Month |
|
Backlog* |
All WEM Skills, WEM Skill |
Week, Month |
|
AHT (Productive) |
All WEM Skills, WEM Skill |
Day, Week, Month |
| AHT (New Hire) | All WEM Skills, WEM Skill | Day, Week, Month |
| AHT (Forecast) | All WEM Skills, WEM Skill | Day, Week, Month |
|
AHT (Actual) |
All WEM Skills, WEM Skill |
Day, Week, Month |
|
AHT Variance (%) |
All WEM Skills, WEM Skill |
Day, Week, Month |
|
Simultaneous Handling |
All WEM Skills, WEM Skill | Day, Week, Month |
|
Service Level (%) |
All WEM Skills, WEM Skill |
Day, Week, Month |
|
Service Level (time) |
All WEM Skills, WEM Skill |
Day, Week, Month |
|
ASA** |
All WEM Skills, WEM Skill |
Day, Week, Month |
|
Maximum Occupancy (%) |
All WEM Skills, WEM Skill |
Day, Week, Month |
|
FTE Base |
All WEM Skills, WEM Skill |
Day, Week, Month |
|
Multi-skill Efficiency |
All WEM Skills, WEM Skill |
Day, Week, Month |
|
Shrinkage (%) |
All WEM Skills, WEM Skill |
Day, Week, Month |
|
FTE Required |
All WEM Skills, WEM Skill |
Day, Week, Month |
|
FTE Actual |
All WEM Skills, WEM Skill, Scheduling Unit |
Week, Month |
| FTE Actual New Hire | Scheduling Unit | Week, Month |
| FTE Actual Total | All WEM Skills, WEM Skill, Scheduling Unit | Week, Month |
| Attrition (%) |
All WEM Skills, WEM Skill, Scheduling Unit |
Week, Month |
|
Attrition (absolute) |
All WEM Skills, WEM Skill, Scheduling Unit |
Week, Month |
|
FTE New Hire |
All WEM Skills, WEM Skill, Scheduling Unit |
Week, Month |
| FTE Total | All WEM Skills, WEM Skill, Scheduling Unit | Week, Month |
|
Projected Service Level (%) |
All WEM Skills, WEM Skill |
Week, Month |
|
Projected ASA** |
All WEM Skills, WEM Skill |
Week, Month |
|
Projected Occupancy (%) |
All WEM Skills, WEM Skill |
Week, Month |
|
FTE Required +/- |
All WEM Skills, WEM Skill |
Week, Month |
|
Hourly Rate |
All WEM Skills, WEM Skill |
Day, Week, Month |
|
FTE Required Cost |
All WEM Skills, WEM Skill |
Day, Week, Month |
|
FTE Actual Cost |
All WEM Skills, WEM Skill |
Week, Month |
|
Cost +/- |
All WEM Skills, WEM Skill |
Week, Month |
|
FTE Required (rollup) |
Scheduling Unit |
Week, Month |
|
FTE Actual Total (rollup) |
Scheduling Unit |
Week, Month |
|
FTE Required +/- (rollup) |
Scheduling Unit |
Week, Month |
| Attrition (%) (rollup) |
Scheduling Unit |
Week, Month |
| Attrition (absolute) (rollup) |
Scheduling Unit |
Week, Month |
|
FTE New Hire (rollup) |
Scheduling Unit |
Week, Month |
| FTE Total (rollup) |
Scheduling Unit |
Week, Month |
* These parameters appear in the plan for deferrable WEM Skills.
** These parameters do not appear in the plan for deferrable WEM Skills.
For details on editing the parameters you can change, see Edit Plan Data.
Date Interval
The dates included in the plan by month, week, or day. The default is month.
-
If the plan does not include the entire week or month in the first or last interval, the column is in italics (including the week or month heading).
-
For week dates, the plan displays the start date of each week in the plan based on the plan's first day of week.
Volume Received (Forecast)
The total number of forecasted volume received for each day, week, or month in the plan.
-
Original values are from the daily volume received values stored in the plan long-term forecast.
-
Decimal value cut off at 0, 1, or 2 decimal places. Uses the WEM Skill's default decimal format on the plan creation date (defined in the WEM Skills view of the Workforce Management (CXone) ).
Volume Received (Actual)
The total number of actual volume received for each day, week, or month in the plan.
-
View only. Values come from the Historical Data page.
-
Whole numbers displayed with 0, 1, or 2 decimal places to align with the forecasted volume received. Uses the WEM Skill's default decimal format on the plan creation date (defined in the WEM Skills view of the Workforce Management (CXone) ).
Volume Received Variance (%)
The volume received variance percent for each day, week, or month in the plan.
VolumeReceivedVariance% = (VolumeReceivedForecast - VolumeReceivedActual) / VolumeReceivedActual x 100
-
View only. Percent value cut off at 2 decimal places.
-
Blank interval when Volume Received (Forecast) or Volume Received (Actual) are 0 or blank for the interval.
-
Negative values are in red text, and positive values or zero are in blue text (for calculated values).
The Volume Received Variance (%) field changes when these fields change for the same interval:
|
Volume Received (Forecast) |
Volume Received (Actual) |
|
Volume Handled
The total number of volume employees need to handle to meet their service level objectives for each day, week, or month in the plan. The expected volume handled for each day is divided evenly over the service level time. The volume handled for each day is the sum of the volume handled for that day plus the portion of volume handled from previous days.
If the number of open days between the forecast volume received date and the end date of the plan is fewer than the number of days in the service level time, the plan does not account for all the forecast volume received in this column. If the daily service level time is less than 24 hours, Enhanced Strategic Planner uses 1 day. If the daily service level time is greater than 24 hours, Enhanced Strategic Planner uses the full day value. For example, if daily service level time is 2.5 days, Enhanced Strategic Planner uses 2.5.
Example:
|
Day |
Sun |
Mon |
Tue |
Wed |
Thu |
Fri |
Sat |
|---|---|---|---|---|---|---|---|
|
Original Forecast Volume Received |
6675 |
0 |
9345 |
7380 |
7160 |
7390 |
7260 |
|
Calculated First Day Volume Handled (using SL %=80) |
1780 |
0 |
3738 |
1686.86 |
2864 |
2956 |
2323.2 |
|
Volume Handled Over SL Time |
|||||||
|
Sun SL Time=3 days |
1780 | 1780 | 1780 | ||||
|
Mon Closed |
|||||||
|
Tue SL Time=2 days |
3738 | 3738 | |||||
|
Wed SL Time=3.5 days |
1686 | 1686 | 1686 | 846 | |||
|
Thu SL Time=2 days |
2864 | 2864 | |||||
|
Fri SL Time=12 hours |
2956 | ||||||
|
Sat SL Time=2.5 days |
2323 | ||||||
|
Total Volume Handled |
1780 |
|
5518 |
7204 |
4550 |
4906 |
2409 |
In the example above, the forecast volume received on Saturday counts as volume handled over 2.5 days (Saturday, Sunday, and Tuesday). But, it does not count the part for Sunday and Tuesday in any volume handled value for the plan. This is because the next open days (Sunday and Tuesday, in this example) fall outside the date range of the plan.
-
View only. Appears for deferrable WEM Skills
-
If Volume Received (Forecast) is 0 or blank for a day, there will be no volume handled based on the forecast volume received for that day (blank). The Volume Handled value for the day is the sum of the volume handled from previous days.
-
If there is no daily service level percent, there are no volume handled based on the forecast volume received for that day (blank). The Volume Handled value for the day is the sum of the volume handled from previous days.
-
If there is a daily service level percent, but no daily service level time, the daily service level time for that day is 1.
-
Decimal value cut off at 0, 1, or 2 decimal places. Uses the WEM Skill's default decimal format on the plan creation date (defined in the WEM Skills view of the Workforce Management (CXone) ).
The Volume Handled field changes when these fields change for the same interval:
|
Volume Received (Forecast) |
Service Level (time) |
Service Level (%) |
Actual FTE Capacity
The number of volume the agents can handle, for each week or month in the plan, based on the number of actual FTE agents and the forecast AHT for each interval. This value also considers occupancy, shrinkage, and multi-skill efficiency, when specified.
If forecast AHT is blank or 0 for the interval, this value is blank. For example, you would change forecast AHT to blank for a holiday.
-
View only. Appears for deferrable WEM Skills.
-
This row does not appear when you display the plan by day.
-
Decimal value cut off at 0, 1, or 2 decimal places. Uses the WEM Skill's default decimal format on the plan creation date (defined in the WEM Skills view of the Workforce Management (CXone) ).
The Actual FTE Capacity field changes when these fields change for the same interval:
|
AHT (Forecast) |
Multi-skill Efficiency |
Attrition (%) |
|
Simultaneous Handling |
Shrinkage (%) |
Attrition (absolute) |
|
Maximum Occupancy(%) |
FTE Actual Total |
FTE New Hire |
Backlog
The number of forecast volume received in previous periods, but not yet handled, for each week or month in the plan.
-
Appears for deferrable WEM Skills.
-
This row does not appear when you display the plan by day.
-
Decimal value cut off at 0, 1, or 2 decimal places. Uses the WEM Skill's default decimal format on the plan creation date (defined in the WEM Skills view of the Workforce Management (CXone) ).
-
Black text for user-entered values, blue text for calculated values.
If the backlog value for the previous interval is blank, the plan uses 0 for this value. If the result of the backlog calculation is a negative value, the plan displays zero for the interval and uses zero to calculate backlog for the next interval.
-
Enter the number of volume in the backlog at the beginning of the plan in the Starting Backlog field. See Plan WEM Skill Settings.
The Backlog field changes when these fields change for the same interval:
|
Volume Received (Forecast) |
Simultaneous Handling |
Attrition (%) |
|
Volume Handled |
Maximum Occupancy (%) |
Attrition (absolute) |
|
Actual FTE Capacity |
FTE Actual Total |
FTE New Hire |
| AHT (Forecast) |
|
|
AHT (Productive)
The forecasted average handle time per volume for fully productive agents for each day, week, or month in the plan. Forecast AHT is based on the defined time standard or historic volume data, including talk time and after-volume work time.
-
You can edit this value in every interval.
-
Original values are from the daily AHT values stored in the plan long-term forecast.
-
Value in seconds cut off at 0, 1, or 2 decimal places. Uses the WEM Skill's default decimal format on the plan creation date (defined in the WEM Skills view of the Workforce Management (CXone) ).
AHT(New Hire)
The average handle time per volume for new hires, for each day, week, or month in the plan. The value comes from the AHT in the new hire learning curve, for each week of training.
-
View only.
-
The plan applies new hire AHT only on the learning curve working days when the WEM Skill is open.
-
Value in seconds cut off at 2 decimal places.
AHT (Forecast)
The average handle time per volume the plan calculates from AHT (Productive) and AHT (New Hire), for each day, week, or month in the plan. The calculation accounts for the number of new hires compared to productive agents, and how much of their time new hires spend handling interactions. When there is no new hire data for the interval, AHT (Forecast) equals AHT (Productive).
-
View only.
-
The plan uses AHT (Forecast) to calculate FTE Base, FTE Required, and the projected service level, ASA, and occupancy.
-
Value in seconds cut off at 2 decimal places.
AHT (Actual)
The actual average handle time per volume for each day, week, or month in the plan. Actual AHT is based on the historic volume data, including talk time and after-volume work time.
-
View only. Values come from the Historical Data page.
-
Blank interval when Volume Received (Actual) is 0 or blank for the interval.
-
Value in seconds cut off at 0, 1, or 2 decimal places. Uses the WEM Skill's default decimal format on the plan creation date (defined in the WEM Skills view of the Workforce Management (CXone) ).
AHT Variance (%)
The average handle time variance percent for each day, week, or month in the plan.
AHTVariance% = (AHTForecast - AHTActual) / AHTActual *100
-
View only. Percent value cut off at 2 decimal places.
-
Blank interval when AHT (Forecast) or AHT (Actual) are 0 or blank for the interval.
-
Negative values are in red text, and positive values or zero are in blue text (for calculated values).
-
For all WEM Skills, the actual AHT uses actual volume received weighting.
-
For deferrable WEM Skills the forecast AHT uses volume handled weighting.
The AHT Variance (%) field changes when these fields change for the same interval:
|
AHT (Forecast) |
AHT (Actual) |
|
Simultaneous Handling
The average number of interactions, or work items, agents can handle at the same time for the WEM Skill for each day, week, or month in the plan. The week or month weighted averages do not include days with no value (blank days).
-
Defaults to 1.0, if you do not have NiCE WFM R7.4 or later.
-
With NiCE WFM R7.4 or later, defaults to the WEM Skill’s simultaneous handling when you create the plan. This comes from the Definition tab of the WEM Skills view (in the Workforce Management (CXone) ).
-
Decimal value cut off at 1 decimal place.
Service Level (%)
The desired percentage of volume handled within the specified service level time (Service Level (time)) for each day, week, or month in the plan. The week or month weighted averages do not include days with no value (blank days).
Your service level goal may be to answer 90% of all volume within 15 seconds.
Service level numbers calculate agent requirements to meet the service level goal.
-
Original values are from the daily service level percent values stored in the plan long-term forecast.
-
Required for deferrable WEM Skills.
-
Percent value cut off at 2 decimal places.
Service Level (time)
The service level time for each day, week, or month in the plan. Week or month values display only if all open days in the interval have the same value.
Service level numbers calculate agent requirements to meet the service level goal.
-
Original values are from the daily service level time values stored in the plan long-term forecast.
-
Required for deferrable WEM Skills.
-
Integer value in seconds.
ASA
The expected average speed of answer for immediate response volume (calls) for each day, week, or month in the plan. The week or month weighted averages do not include days with no value (blank days).
Your ASA goal may be to answer all immediate response volume within 45 seconds.
ASA numbers calculate agent requirements to meet the ASA goal.
-
Original values are from the daily ASA values stored in the plan long-term forecast.
-
This row does not appear for deferrable WEM Skills,.
-
Value in seconds cut off at 2 decimal places.
Maximum Occupancy (%)
The average percentage of time you want agents occupied handling volume for each day, week, or month in the plan. The week or month weighted averages do not include days with no value (blank days).
Your maximum occupancy goal could be for agents to spend 85% of their time handling volume.
Maximum occupancy percentages calculate agent requirements to meet the maximum occupancy goal.
-
Original values are from the daily maximum occupancy percent values stored in the plan long-term forecast.
-
Percent value cut off at 2 decimal places.
-
The deferrable WEM Skills require a service level goal.
FTE Base
The total number of forecasted FTE agents required to handle the workload for each day, week, or month in the plan. Agents must meet specified service level, ASA, and maximum occupancy goals.
-
View only. Decimal value cut off at 2 decimal places.
-
Displays ??? when unable to calculate FTE base.
-
All FTE calculations use the daily requirements of the WEM Skills in the plan . FTE calculations also take into account:
-
the WEM Skill simultaneous handling
-
the median patience time, if this value is not blank (see Plan Settings)
The plan calculates FTE values for a deferrable WEM Skill using each of the WEM Skill’s forecast objectives. If any of the forecast objectives are blank for the interval, the plan does not use that objective. If there is no value for forecast AHT, the plan does not calculate FTE values. There are no FTE values for days when the WEM Skill is closed, since the plan cannot distribute data to any hours on these days.
-
FTE Base changes when these fields change for the same interval:
|
Volume Received (Forecast) |
Simultaneous Handling |
ASA |
|
Volume Handled |
Service Level (%) |
Maximum Occupancy (%) |
|
AHT (Forecast) |
Service Level (time) |
When the FTE Base changes, these calculated fields change for the interval:
|
FTE Required |
FTE Required +/- |
FTE Required Cost |
|
Cost +/- |
|
|
Multi-skill Efficiency
The efficiency gained by having agents with multiple skills for each day, week, or month in the plan. The week or month weighted averages do not include days with no value (blank days) or days where the FTE Base is ???.
-
Original values are from the daily multi-skill efficiency values stored in the plan long-term forecast.
-
Displays ??? when unable to calculate multi-skill efficiency.
-
Decimal value cut off at 4 decimal places.
Shrinkage (%)
The percentage of time paid agents are unproductive for each day, week, or month in the plan. The week or month weighted averages do not include days with no value (blank days) or days where the FTE Base is ???.
-
Original values are black text from the daily shrinkage percent values stored in the plan long-term forecast.
-
Percent value cut off at 2 decimal places.
-
Displays ??? when unable to calculate shrinkage percent.
-
Black text for edited values, blue text if you edited any of the shrinkage sub-categories.
FTE Required
The required number of FTE agents, considering shrinkage and multi-skill efficiency, for each day, week, or month in the plan.
-
View only. Decimal value cut off at 2 decimal places.
-
Displays ??? when unable to calculate FTE required.
FTE Required changes when these fields change for the same interval:
|
Volume Received (Forecast) |
Service Level (%) |
FTE Base |
|
Volume Handled |
Service Level (time) |
Multi-skill Efficiency |
|
AHT (Forecast) |
ASA |
Shrinkage (%) |
|
Simultaneous Handling |
Maximum Occupancy (%) |
FTE Actual
The number of fully productive FTE agents the center will employ during the week or month in the plan.
If you do not have an FTE actual in the first week of the plan, the FTE actual and attrition calculations may not be accurate.
-
This row does not appear when you display the plan by day.
-
Decimal value cut off at 2 decimal places.
-
Values are black text for user-entered values, blue text for calculated values.
-
The plan shows 0 for negative values and uses 0 in other calculations. The FTE actual value comes from the previous interval’s attrition and FTE actual. New hires count in FTE Actual when their new hire class ends. Until then, their contribution appears in FTE Actual New Hire and FTE Actual Total.
-
FTE Actuals (Weekly/Monthly) calculation:
-
Weekly: Week-beginning FTE minus (–) attrition (absolute).
-
Monthly: Prior week FTE Actuals (last week in the previous month) minus (–) attrition (absolute).
-
Attrition values are adjusted for each day in the previous month for the month-beginning value.
-
The productive share of new hires for each week or month in the plan. For each class, the plan multiplies the number of new hires by the % Productive for that week of the learning curve. For example, a class of 20 new hires at 10% productive time adds 2 FTE.
-
Appears for Scheduling Units only.
-
View only. This row does not appear when you display the plan by day.
-
Decimal value cut off at 2 decimal places.
FTE Actual plus FTE Actual New Hire, for each week or month in the plan. The plan uses this value for FTE Required +/- and the projected service level, ASA, and occupancy.
-
View only. This row does not appear when you display the plan by day.
-
Decimal value cut off at 2 decimal places.
Attrition (%)
The percentage reduction in actual staff for each week or month in the plan. This row is blank for new plans.
-
View only. This row does not appear when you display the plan by day.
-
Calculated after you enter the Attrition (absolute) for the interval. This value is blank when the FTE actual is blank or 0, or when the absolute attrition is blank.
-
Percent value cut off at 2 decimal places.
-
Maximum displayed value is 100.00.
Attrition (absolute)
The absolute reduction in actual staff that takes effect the next interval for each week or month in the plan. This row is blank for new plans.
-
This row does not appear when you display the plan by day.
-
Decimal value cut off at 2 decimal places.
-
Values are black text for user-entered values, blue text for calculated values.
FTE New HireThe number of new hires whose class starts in the week or month. The plan calculates this value from your new hire classes, and you cannot edit it.
-
View only. This row does not appear when you display the plan by day.
-
Decimal value cut off at 2 decimal places.
FTE Total
The total number of FTE agents for each week or month in the plan, including new hires who are still in training. New hires count from their class start date. The plan uses this value to calculate FTE Actual Cost.
-
View only. This row does not appear when you display the plan by day.
-
Decimal value cut off at 2 decimal places.
Projected Service Level (%)
The projected service level percent for each week or month in the plan. This is the estimated percentage of volume that will be answered within the service level goal. It is based on FTE Actual Total plus the long-term forecast output of volume received or volume handled, AHT (Forecast), multi-skill efficiency, and shrinkage. The forecast AHT takes into account the WEM Skill simultaneous handling.
The week or month weighted values do not include days with no value (blank days) for projected service level percent or forecast volume received.
-
View only. This row does not appear when you display the plan by day.
-
Percent value cut off at 2 decimal places.
-
Displays ??? when unable to calculate projected service level percent, or when Volume Received (Forecast), AHT (Forecast), Service Level (time) or FTE Actual Total is blank for any of the open days in the interval.
For this parameter, if your staffing is very low, Enhanced Strategic Planner cannot calculate a good expectation of service level. Projected Service Level (%) will show ???. This is because Enhanced Strategic Planner does not yet take into account abandons. Specifically, time to abandon, which can create a large variance in service level when staffing is very low.
Projected Service Level (%) changes when the median patience time setting changes.
Projected Service Level (%) changes when these fields change for the same interval:
|
Volume Received (Forecast) |
Simultaneous Handling |
Shrinkage (%) |
|
Volume Handled |
Service Level (time) |
FTE Actual Total |
|
AHT (Forecast) |
Multi-skill Efficiency |
|
Projected ASA
The projected ASA for each week or month in the plan. This is the estimated ASA. It is based on FTE Actual Total plus the long-term forecast output of volume received, AHT (Forecast), multi-skill efficiency, and shrinkage. The forecast AHT takes into account the WEM Skill simultaneous handling.
The week or month weighted values do not include days with no value (blank days) for projected ASA or forecast volume received.
-
View only. This row does not appear when you display the plan by day.
-
Value in seconds cut off at 2 decimal places.
-
This row does not appear for deferrable WEM Skills.
-
Maximum displayed value is 9999.00. Displays ??? when unable to calculate projected ASA, or when Volume Received (Forecast), AHT (Forecast) or FTE Actual Total is blank for any of the open days in the interval.
Projected ASA changes when the median patience time setting changes.
Projected ASA changes when these fields change for the same interval:
|
Volume Received (Forecast) |
Simultaneous Handling |
Shrinkage (%) |
|
Volume Handled |
Multi-skill Efficiency |
FTE Actual Total |
|
AHT (Forecast) |
|
|
Projected Occupancy (%)
The projected occupancy percent for each week or month in the plan. This is the estimated percentage of time staff will be working volume instead of being idle, waiting for volume to arrive. It is the percentage of volume load versus expected staffing where:
-
volume load includes volume handled or forecast volume handled and AHT. The forecast AHT takes into account the WEM Skill simultaneous handling.
-
expected staffing includes FTE Actual Total. FTE Actual Total accounts for attrition and the productive share of new hires, multi-skill efficiency, and shrinkage.
The week or month weighted values do not include days with no value (blank days) for projected occupancy percent or FTE Actual Total.
-
View only. This row does not appear when you display the plan by day.
-
Percent value cut off at 2 decimal places.
-
Maximum displayed value is 100.00. Displays ??? when FTE Actual Total is 0, or when Volume Received (Forecast), AHT (Forecast) or FTE Actual Total is blank for any of the open days in the interval.
Projected Occupancy (%) changes when these fields change for the same interval:
|
Volume Received (Forecast) |
Simultaneous Handling |
Shrinkage (%) |
|
Volume Handled |
Service Level (time) |
FTE Actual Total |
|
AHT (Forecast) |
Multi-skill Efficiency |
|
FTE Required +/-
The difference between FTE Actual Total and FTE Required for each week or month in the plan.
-
View only. This row does not appear when you display the plan by day.
-
Decimal value cut off at 2 decimal places.
-
Negative values are in red text, and positive values or zero are in blue text (for calculated values).
-
Blank when FTE Actual Total or FTE Required is blank. Displays ??? when FTE Required is ???.
FTE Required +/- changes when these fields change for the same interval:
|
Volume Received (Forecast) |
ASA |
FTE Required |
|
Volume Handled |
Maximum Occupancy (%) |
FTE Actual Total |
|
AHT (Forecast) |
FTE Base |
Attrition (%) |
|
Simultaneous Handling |
Multi-skill Efficiency |
Attrition (absolute) |
|
Service Level (%) |
Shrinkage (%) |
FTE New Hire |
| Service Level (time) |
Hourly Rate ($)
The FTE hourly rate for agents in the plan WEM Skills. Change this field to see the effect on FTE cost for the plan.
-
Original value is from the WEM Skill’s hourly rate, defined in the What-if Parameters tab of the WEM Skills view (in the Workforce Management (CXone) ).
-
Currency value cut off at 2 decimal places. Currency symbol for the initial release is $.
FTE Required Cost ($)
The cost of the FTE requirement for each day, week, or month in the plan.
-
View only. Currency value cut off at 2 decimal places. Currency symbol for the initial release is $.
-
Blank when FTE Required or Hourly Rate is blank. Displays ??? when FTE Required is ???.
FTE Required Cost changes when these fields change for the same interval:
|
Volume Received (Forecast) |
Service Level (time) |
Multi-skill Efficiency |
|
Volume Handled |
ASA |
Shrinkage (%) |
|
AHT (Forecast) |
Maximum Occupancy (%) |
FTE Required |
|
Simultaneous Handling |
FTE Base |
Hourly Rate |
|
Service Level (%) |
FTE Actual Cost ($)
The cost of the actual FTE for each week or month in the plan. The plan calculates it from FTE Total and the hourly rate, so it includes new hires from their class start date.
-
View only. This row does not appear when you display the plan by day.
-
Currency value cut off at 2 decimal places. Currency symbol for the initial release is $.
-
Blank when FTE Total or Hourly Rate is blank.
FTE Actual Cost changes when these fields change for the same interval:
|
FTE Actual |
Attrition (absolute) |
Hourly Rate |
|
Attrition (%) |
FTE New Hire |
FTE Total |
Cost +/- ($)
The cost difference for each week or month in the plan.
-
View only. This row does not appear when you display the plan by day.
-
Currency value cut off at 2 decimal places. Currency symbol for the initial release is $.
-
Negative values are in red text, and positive values or zero are in blue text (for calculated values).
-
Blank when FTE Actual Cost or FTE Required Cost is blank. Displays ??? when FTE Required Cost is ???.
Cost +/- changes when these fields change for the same interval:
|
Volume Received (Forecast) |
Maximum Occupancy (%) |
Attrition (%) |
|
Volume Handled |
FTE Base |
Attrition (absolute) |
|
AHT (Forecast) |
Multi-skill Efficiency |
FTE New Hire |
|
Simultaneous Handling |
Shrinkage (%) |
Hourly Rate |
|
Service Level (%) |
FTE Required |
FTE Required Cost |
|
Service Level (time) |
FTE Actual |
FTE Actual Cost |
|
ASA |
FTE Total |
Total
The totals for the rows listed below, using the same format as the values in the row.
|
Volume Received (Forecast) |
FTE Required |
FTE Required +/- |
|
Volume Handled |
FTE Actual |
FTE Required Cost |
|
Actual FTE Capacity |
Attrition (absolute) |
FTE Actual Cost |
|
FTE Base |
FTE New Hire |
Cost +/- |
| FTE Actual Total | FTE Total |
-
View only.
-
Negative values are in red text, and positive values or zero are in blue text (for calculated values).
-
If all values in a row are blank, the total is blank.
-
The total calculation does not include ??? values.
Average
The average for each row, using the same format as the values in the row . There is no average for Volume Received (Actual), Volume Received Variance (%), AHT (Actual), or AHT Variance (%).
-
View only.
-
Negative values are in red text, and positive values or zero are in blue text (for calculated values).
-
The average calculation for the +/- (OU) parameters uses the sum of the absolute value of the row values. The sign for these averages comes from the sum of the signed values. If this sum is positive, the average is a positive value. If the sum is negative, the average is a negative value.
-
The average calculation does not include partial week or partial month values at the beginning or end of a plan.
-
If all values in a row are blank, the average is blank.
-
The average calculation does not include ??? or blank values.