

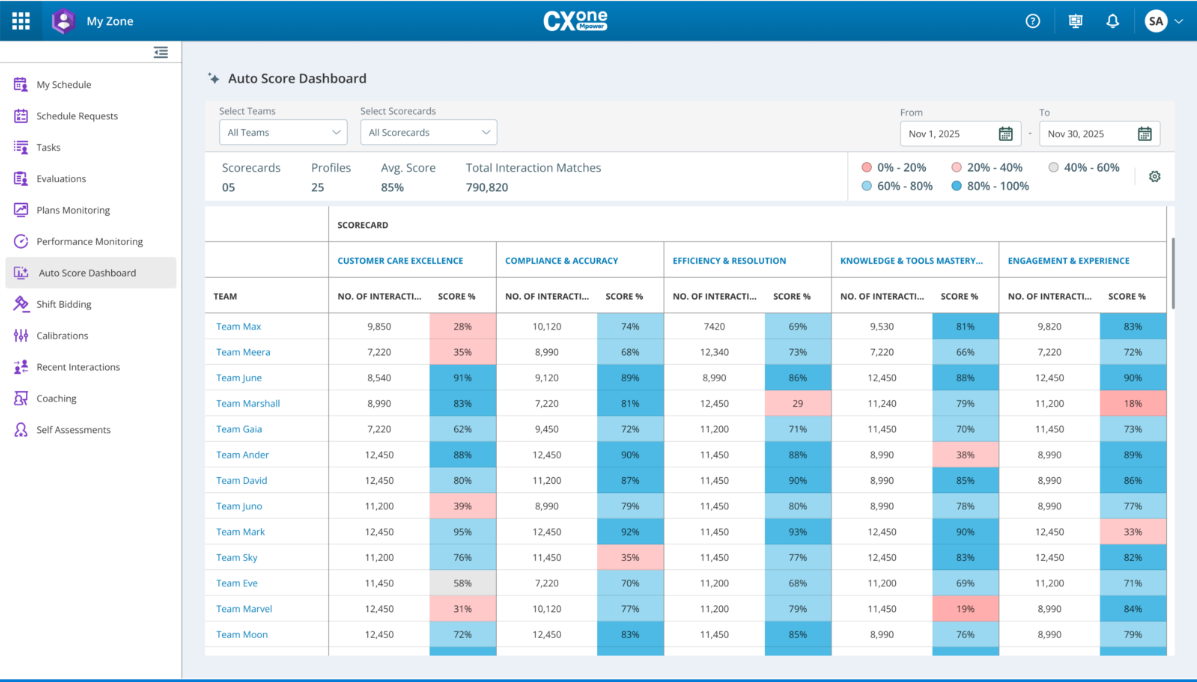
The Auto Score Dashboard provides a consolidated view of team performance across key metrics such as Customer Care Excellence, Compliance & Accuracy, and Knowledge and Tools Mastery. It also helps supervisors monitor team performance, identify issues, and provide targeted coaching using data-driven insights. This dashboard is integrated into My Zoneand is accessible to supervisors and managers with the appropriate permissions.
Access your Auto Score Dashboard
-
Click the app selector
 and select My Zone > Auto Score Dashboard.
 -
To configure Dashboard filters, do the following:
-
From the Teams list, select one or more teams to include in the dashboard view.
-
From the Scorecards list, select the relevant scorecards for evaluation.
-
Click the Date range field and select the desired date range for the report.
Understand your Auto Score Dashboard Metrics:
-
Scorecards: Total number of scorecards selected.
-
Teams: Number of teams included in the view.
-
Average Score: Combined average score across selected teams.
-
Total Interaction Matches: Total interactions evaluated.
-
Color coding legend: Refer to the color legend to quickly identify high and low-performing agents.
The detailed view displays the Agent Name, Number of Interactions, Score % for: For example, Customer Care Excellence, Compliance & Accuracy, and Knowledge and Tools Mastery.
-
-
From the Scorecards table, select the team whose performance you want to drill down into.
-
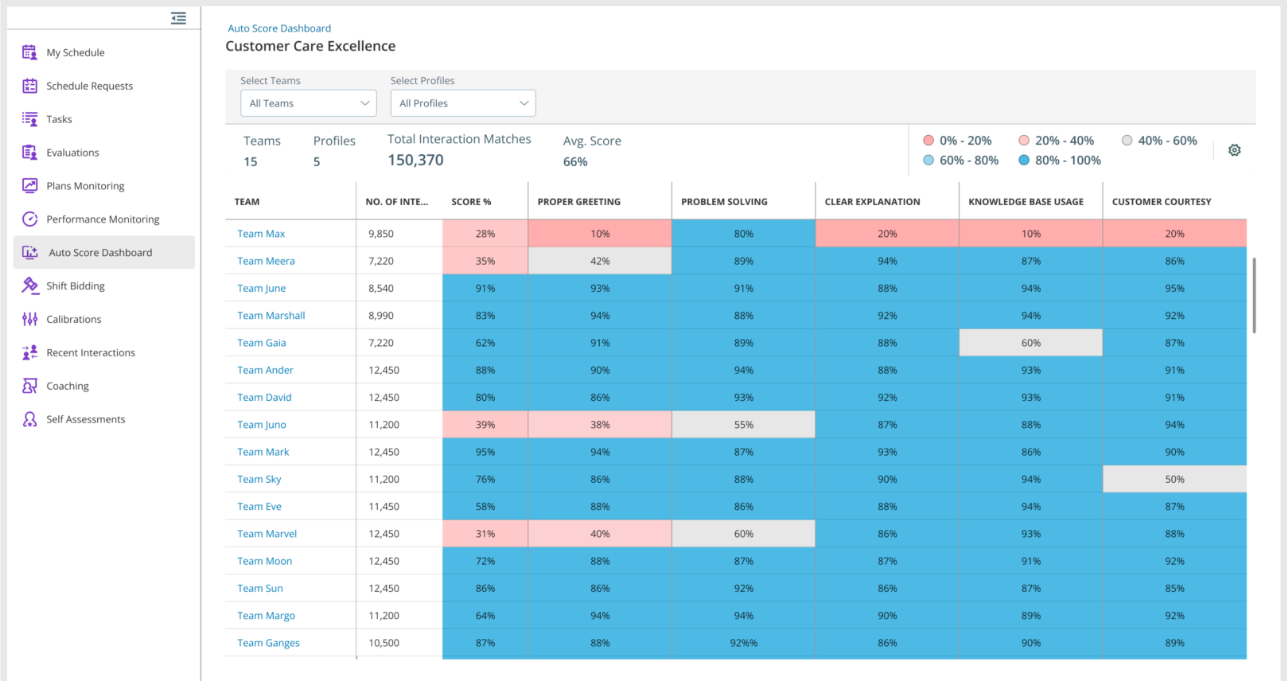
Click the team name (For example, Customer Care Excellence) in the first column to see a drill-down view of the agent profile. This opens a detailed view showing agent-level performance metrics.
-
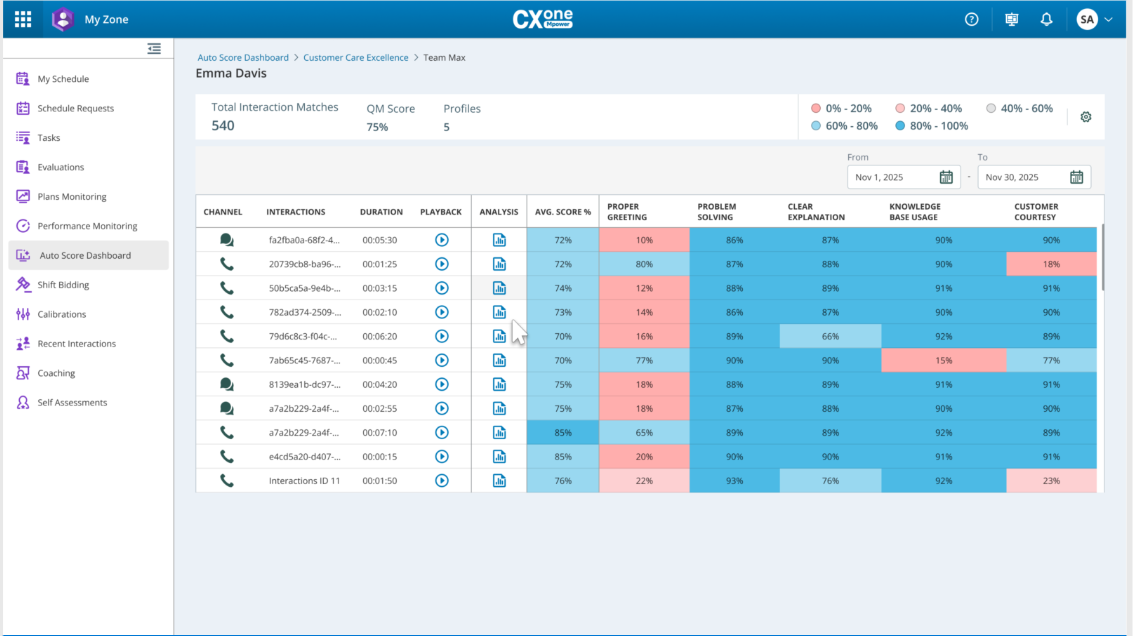
From the dashboard, choose the agent you want to review (For example, agent Emma Davis). The dashboard lists all recent interactions for the selected agent.
-
To review Interaction Breakdown, do the following:
-
Check how the agent scored across different profiles in recent conversations.
-
Compare the agent’s average score with team benchmarks.
-
-
To investigate performance issues using the two options:
-
Click on the Playback button to listen to the recorded interaction manually to identify issues.
-
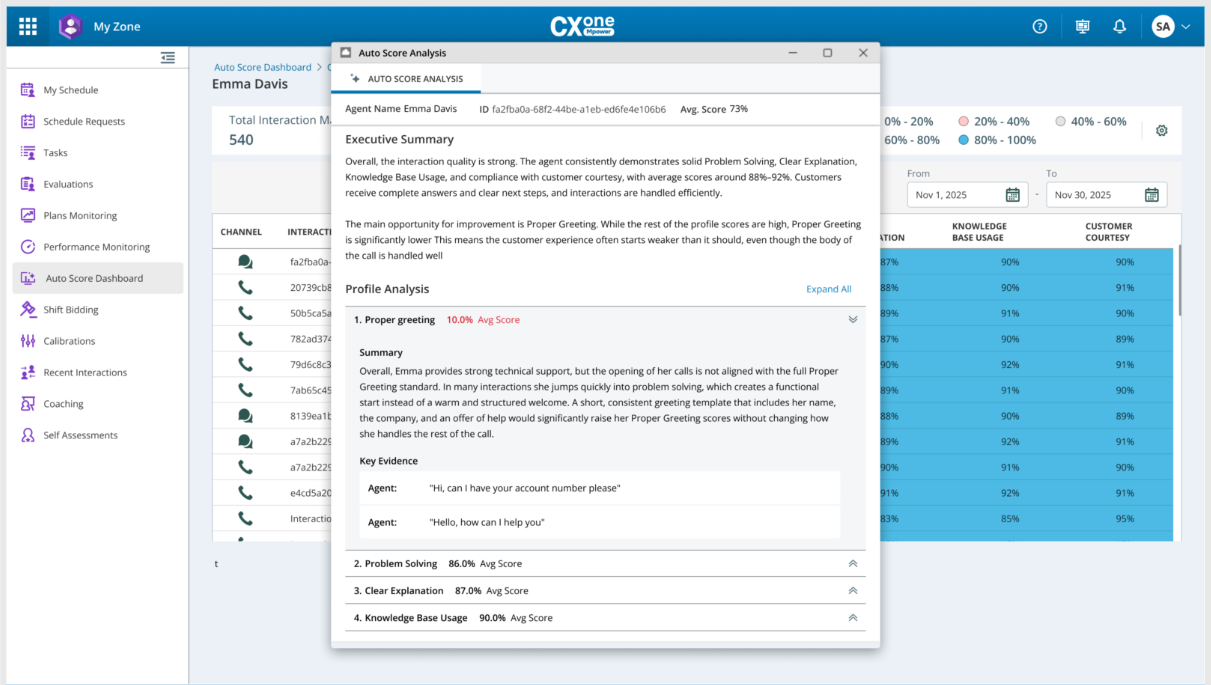
Click Analysis icon to view detailed insights for the selected interaction. The following Auto Score Analysis is displayed:
When you open Analysis, you can:
-
View an Executive Summary showing strengths and improvement areas.
-
Drill down to Profile Analysis to view profile-level scores (For example, Greeting profile scored 5%).
-
See highlighted transcript sections that contributed to the score as evidence.
-
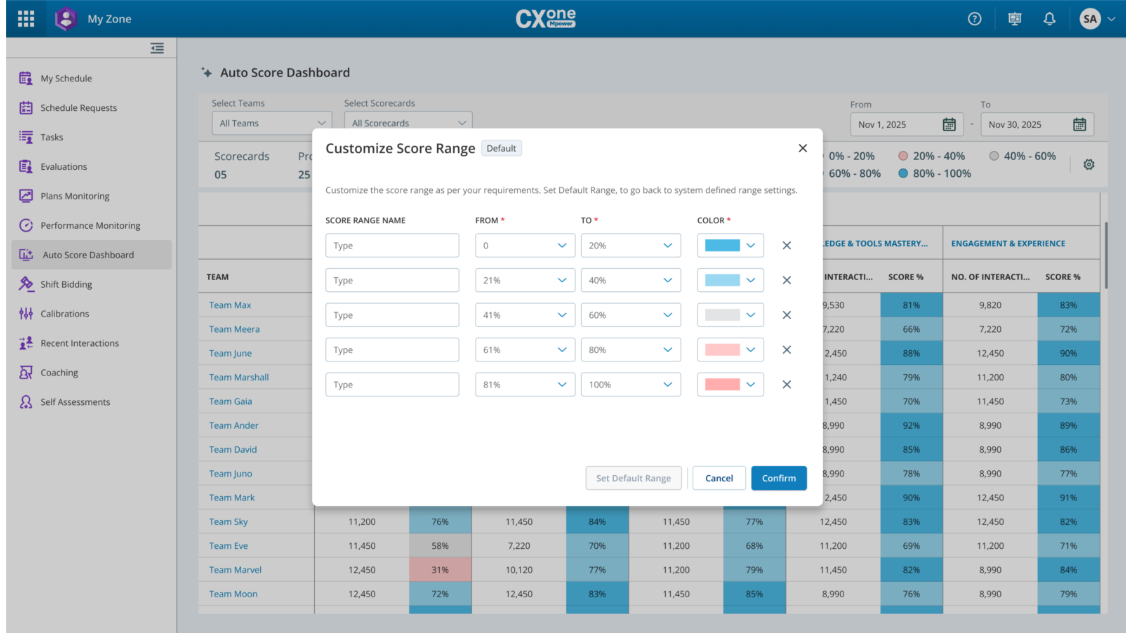
Customize Score Range
Customizing score ranges helps you set performance levels that match your organization’s needs. Instead of using the default settings, you can create your own ranges and group interactions into clear categories like Excellent, Satisfactory, or Needs Improvement. This makes it easy for supervisors and managers to understand performance at a glance. In this section, we will see how to set up score ranges so your evaluations are accurate and meaningful.
To customize score range:
-
From the Auto Score Dashboard, click the settings
 icon. The Customize Score Range window displays predefined ranges such as:
-
Poor: 0% – 20%
-
Average: 21% – 40%
-
Outstanding: 41% – 60%
-
Additional range: (For example, 81% – 100%)
-
-
In the Score Range Name column, click inside the text box to rename the range (For example, change Outstanding to Excellent).
-
Use the From and To dropdowns to set the percentage range for each category. For example, adjust Poor from 0%–20% to 0%–25% if necessary.
-
Click the color dropdown in the Color column to select a color that visually represents the range. For example, Red for Poor, Green for Excellent.
-
Click Add Range to add a new range.
-
If you want to revert to system-defined settings, click Set Default Range.
-
After customizing all ranges, click Confirm to save your changes. Otherwise, click Cancel.
How Auto Score Handles Deleted, Deactivated, and Removed Profiles
Auto Score continues to score interactions based on the profiles associated with a scorecard. The behavior depends on whether the profile is deleted in AI Studio or removed from the scorecard in Quality Management (CXone).
Auto Score Forecast Calculations
Auto Score Forecast estimates how many scores you can expect by analyzing interactions that match your selected filters from the last 180 days.
The forecast displays:
-
The total number of matching interactions.
-
The average number of interactions per day.
If less than 180 days of historical data is available, AutoScore still generates a forecast. The estimate is based on the available interaction history, which may result in lower forecast totals and daily averages.
Deleted or Deactivated Profiles in AI Studio
Deleting or deactivating a profile in AI Studio does not affect Auto Score if the profile is still linked to a scorecard. Quality Management (CXone) keeps a copy of the profile settings. As a result:
-
Auto Score continues to score interactions.
-
Scheduled scorecard runs continue as usual.
-
The profile remains visible in the Auto Score Dashboard.
-
Existing and new scoring results remain available.
For Example:
A scorecard contains three active profiles:
-
Profile A
-
Profile B
-
Profile C
If Profile B is deleted or deactivated in AI Studio but remains configured in the scorecard:
-
The scorecard continues to run.
-
Profiles A, B, and C continue to be scored.
-
The Auto Score Dashboard continues to display results for Profile B.
-
No scoring data is lost.
Removed Profiles in a Scorecard
Removing a profile from a scorecard has a different impact. After a profile is removed:
-
Auto Score stops using the profile in future scoring runs.
-
New interactions are no longer scored with that profile.
-
Existing scoring results are kept.
-
Historical dashboard data remains available for periods when the profile was previously used.
Auto Score Dashboard Behavior
The Auto Score Dashboard retains historical results that were generated before the profile was removed.
For a removed profile:
-
Previous scoring results remain visible in the dashboard.
-
Historical reports and trends continue to include past scores.
-
No new scores are generated after the profile is removed from a Scorecard.
 Key Considerations
| action | Auto Score Continues Scoring? | Historical Results Retained? | Appears in Dashboard? |
|---|---|---|---|
| Profile deleted or deactivated in AI Studio (still linked to scorecard) | Yes | Yes | Yes, including future scores |
| Profile removed from a scorecard in Quality Management (CXone) | No | Yes | Yes, for historical data only |