

The Agent Session Report provides supervisors with comprehensive data on their agents in one centralized location. It highlights key metrics such as the duration of lunch breaks and daily idle time. By consolidating multiple existing reports, this tool enables supervisors to delve deeper into agent performance and metrics.
Each agent session is tracked from login to logout, with the report measuring data for each session. The report's widgets display aggregated data for all agent sessions within the selected parameters. Supervisors can click on individual widget elements to access more detailed information.
A contact center manager wants to optimize agent productivity and ensure efficient use of time during shifts. By reviewing the report, the manager can identify patterns in agent behavior that may require adjustments to improve overall performance.
The report helps assess adherence to scheduled activities and breaks, ensuring agents are following the expected guidelines. The detailed session information allows the manager to make informed decisions about scheduling and workload distribution, aligning agent activities with operational needs.
You must have these permissions:
-
Dashboard > Dashboard Templates > Agent Session: On
-
Dashboard > Dashboards: View
-
Dashboard > Dashboards: Edit (optional)
If you cannot access the reporting templates or Dashboard, or if widget data is not loading, check with your administrator. The administrator can verify your role's reporting, dashboard, and widget permissions by visiting Admin > Security Settings > Roles and Permissions.
Data Overview
This report includes:
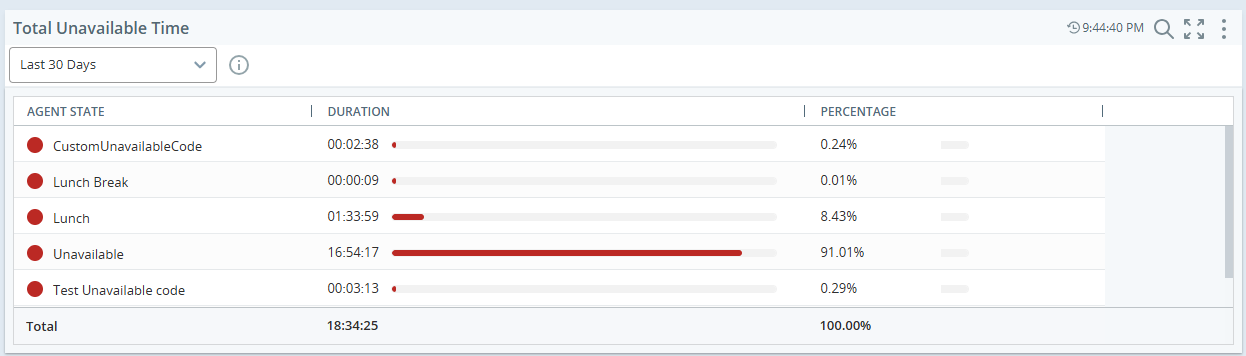
Total Unavailable Time
Widget type: Agent state summary
This widget provides a comprehensive breakdown of the time an agent spends in various "Unavailable" states during their session. Each unavailable state such as Break, Meeting, Training, or System Issues is displayed individually, allowing supervisors to understand the specific reasons behind an agent's unavailability. By segmenting these states, it offers greater visibility into non-productive time, helping identify patterns, optimize scheduling, and improve overall workforce efficiency.
-
Click checkbox for Unavailable states
-
Sort widget from highest to lowest
-
Date: Today, yesterday, Last 7 days.
-
Default data duration: Yesterday
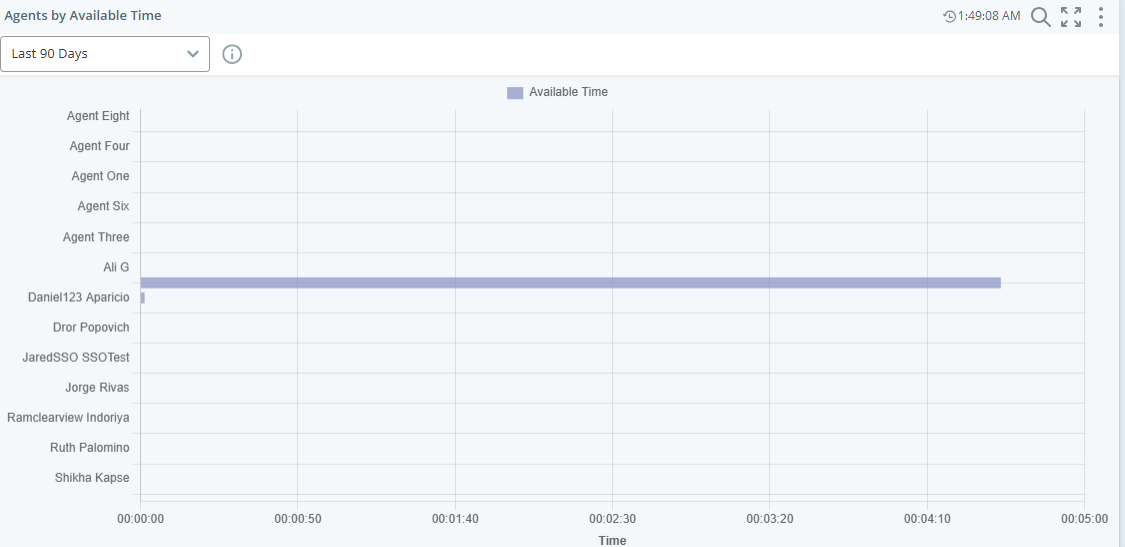
Agents by Available Time
Widget type: Metric Summary
This widget shows how much time each selected agent was available during their session. It displays one key number for each agent, making it easy to compare availability across the team. This helps managers see who was ready to take calls or handle tasks, and for how long. It’s useful for tracking performance and making better staffing decisions.
-
View by: Agent
-
Metric: Available Time
-
Date: Today, yesterday, Last 7 days.
-
Default data duration: Yesterday
Agents by Working Time
Widget type: Metric Summary
The Agents by Working Time widget displays one key metric per selected agent, helping monitor how agents spend their working hours. It supports agent selection, shows time-based performance data, and includes features like visual indicators and interactive elements for quick insights.
-
View by: Agent
-
Metric: Working Time
-
Date: Today, yesterday, Last 7 days.
-
Default data duration: Yesterday
Agent Session Detail
The Agent Session details presents a list of all agent sessions that match your selected filter parameters. The table below provides descriptions of the various time columns displayed in this dataset.
Click Options  and then Settings on the dataset to filter the data you want to see.
You can customize the columns:
-
Click
 to auto size a specific column or all the columns.
 -
Click
 to select filter options.
 -
Click
 to select the columns you want to see on the widget.
You can personalize your column settings by adjusting the column size, sort, filter, and arrangement, and then save these changes, even with the View dashboard permission.
Sorting table columns
You can sort the data in the table by clicking a column header. To apply a secondary sort, hold down the Shift key and click another column header.
-
The primary sort column displays a 1 next to the column title.
-
The secondary sort column displays a 2 next to the column title.
|
Time Column |
description |
|---|---|
|
Agent session no' |
The agent's session no' |
|
Agent name |
The agent's first and last name. |
|
Agent No |
The unique ID number the system assigned to the agent. |
|
Session start and time |
Session start and time |
|
Session end and time |
Session end and time |
|
Agent Session Time |
Total time that the agent was logged in to CXone. |
|
Available Time |
Total time that the agent was in an Available state. |
|
Working Time |
Total time that the agent was in a type of busy state where they were actively handling a contact. This includes any Working unavailable codes. |
|
Unavailable Time |
Total time that the agent was in an Unavailable state and unable to accept contacts. |
|
System Time |
Total time between the agent logging in and out of the agent application. |
Agent's Unavailable Detail
Widget type: Report Widget
This dataset shows the duration and instances when the agent is unavailable, along with the start and end times of their session.
-
Dataset: Agents Unavailable detail
-
Date: Today, yesterday, Last 7 days.
-
Default data duration: Yesterday
|
Column |
description |
|---|---|
|
Agent session no' |
The agent's session no' |
|
Agent name |
The agent's first and last name. |
|
Agent No |
The unique ID number the system assigned to the agent. |
|
Session activity start and time |
Session start and time |
|
Session activity end and time |
Session end and time |
|
Unavailable state name |
The Unavailable state name, |
|
Unavailable Time |
Total time that the agent was in an Unavailable state and unable to accept contacts. |