

Automation Opportunity is designed to help you identify customer intents with the highest potential for automation. By analyzing historical interaction data, it uncovers repetitive tasks, common issues, and agent behaviors that can be automated to save time, reduce costs, and improve consistency.
This feature provides actionable insights, including automation potential by intent category, automation score, and ROI calculations. You can see forecasts highlighting which intents and subtopics are the best candidates for automation over the next 12 months, enabling you to make informed decisions and implement automation seamlessly.
Accessing Automation Opportunity
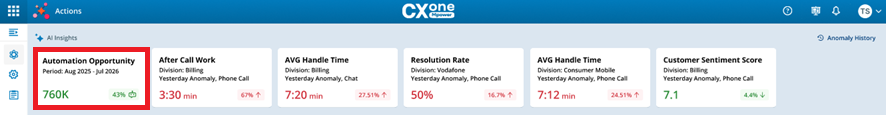
To access the Automation Opportunity dashboard, go to the AI Insights section and locate the Automation Opportunity card. Click the Automation Opportunity card to open the dashboard and view detailed insights into areas where automation can improve efficiency and reduce costs.
-
Access to the User tab of the Settings page is available only if you have an IA Advanced or IA Premium license and if the browser language is set to English.
-
The Automation Opportunity card and dashboard are visible only if you have selected the Enable Automation Opportunity checkbox in the User tab of the Settings page. For details, refer to the Settings topic.
Automation Opportunity Dashboard
The dashboard is populated based on the Analyze Period selected in the User tab of the Settings page. When you click the Automation Opportunity card, the system uses this date range to display insights. For all other filters, such as Team, Skills, Channel, Direction, and Category, the application defaults to All unless you apply specific selections. For details on configuring the Analyze Period, refer to the Settings topic.
Based on the filters configured in the User tab of the Settings page, the Conversational Panel displays the top three intents (topics) that can be automated. You can also apply filters such as, Team, Skills, Channel, Direction, and Category, on the Analyze Period to refine the data view. If the selected analysis period is shorter than a year, the system extrapolates the data to estimate annual automation potential.
In the Automation Opportunity dashboard, you can:
-
Filter data by Date range, Team, Skills, Channel, and Direction.
-
Ask Natural Language Questions on Automation Opportunity Data.
Filter the Automation Opportunity Dashboard
You can filter the Automation Opportunity dashboard to view data for a specific time range, team, skills, channel, or direction. Use filters to narrow down insights and focus on relevant automation opportunities.
-
At the top of the dashboard, select the Date Range field. Choose one of the preset options:
-
Last 30 Days
-
Last 60 Days
-
Last 90 Days
-
Previous Month
-
Last X Days
-
Today
-
Or select a custom range using the calendar. For example, click 23 September 2025 as the start date and 21 December 2025 as the end date.
-
-
You can also select filters for Team, Skills, Channel, Direction, and Category. This selection is optional.
-
Team: Choose one or more teams.
-
Skills: Select specific skills relevant to the interactions.
-
Channel: Filter by voice and chat channels.
-
Direction: Choose inbound or outbound directions.
-
Category: Filter by high‑level intent categories to quickly focus on broader themes such as Billing or Account Management.
-
-
Click Apply to refresh the dashboard with your selected filters.
Use narrow filters, for example, one team and one channel when you need precise automation opportunities for a pilot.
-
To remove all filters and return to the default view, click Clear.
Review Analyze Period
The Analyze Period panel shows key performance indicators (KPIs) based on the filters you select, such as Date Range, Team, Skills, Channel, Direction, and Category. These KPIs summarize interaction data for your chosen period.
Reviewing these KPIs helps you understand the overall interaction trends and complexity within the selected period. By analyzing metrics such as total interactions, average duration, and identified intents and actions, you can determine which processes are repetitive, time-consuming, or high-volume. This insight is critical for identifying areas with the greatest automation potential, prioritizing automation efforts, and estimating the impact on efficiency and cost reduction.
The panel includes the following KPIs:
-
Total Interactions – Represents the total number of customer interactions within the selected date range.
-
Avg. Duration (MM:SS) – Indicates the average duration of interactions in minutes and seconds.
-
Avg. Segments – Displays the average number of conversation segments per interaction. A segment refers to a distinct part of the conversation, such as a question, response, or action.
-
Intents Identified – Displays the total number of unique customer intents detected across interactions.
-
Actions Identified – Represents the number of agent actions captured during interactions. Actions include tasks such as updating records, processing refunds, or providing account details.
-
Number of Agents – Indicates the total number of unique agents involved in the interactions during the selected period.
Assess Yearly Impact Projection with AI insight
The AI Insights card provides an estimate of the potential impact of automation for the selected period. It uses interaction data and cost metrics to calculate projected savings and Return on Investment (ROI).
The purpose of the AI Insights card is to help you understand the business value of automating interactions. It provides a clear, quantitative estimate of potential cost savings and efficiency gains, enabling you to make informed decisions when prioritizing automation initiatives.
The AI Insights card displays two key elements:
-
Automation Score: The average automation opportunity across the top 3 intent topics identified by the application. It represents how much of each intent’s interaction volume can be automated.
-
ROI (%): The estimated cost savings if the identified intents are automated. ROI is calculated based on the automation score that is average automation opportunity across top intents.
You can use the card as follows:
-
Apply filters for Date Range, Team, Skills, Channel, Direction, and Category.
-
Review the automation score and ROI to:
-
Identify high-value automation opportunities.
-
Justify automation investments with data-driven insights.
-
-
Use the narrative insight to communicate benefits to stakeholders.
How to Use Automation Charts and Widgets for Prioritization
The dashboard consists of three charts and a widget. These charts and the widget are interconnected parts of the automation analytics workflow and understanding how the information flows between them is key for decision-making.
Intents are organized into three levels: category, topic, and subtopic. A subtopic represents the most specific reason for which a customer contacted the business—for example, “Pending payment” or “Account closure.” These subtopics are grouped into broader topic, such as “Payment Issues,” and further classified under high-level category such as “Billing.”
This hierarchy allows you to analyze automation opportunities at different levels of detail. Charts and widgets use this structure to display automation potential, helping you prioritize subtopics with the highest impact while maintaining visibility into broader topics and categories.
Automation Potential by Intent Category chart is your starting point, use this chart to identify high-impact categories. For example, if Troubleshooting has 60% automation potential and high interaction volume, you know this category is worth exploring further.
After identifying a category from the first chart, use the Automation Opportunity and KPI chart to prioritize specific intents within that category. For example, within Troubleshooting, an intent like Payment issue may have 60% automation opportunity, long duration, and negative sentiment → high priority for automation.
Once you pick an intent from the second chart, the Top 10 Subtopics by Automation Opportunity chart helps you identify granular tasks with the highest automation share. For example, for Payment issue, subtopics like Account closure or Pending payments may have 100% automation share, making them quick wins.
The Top 15 Actions By Volume widget, complements the other charts by showing what agents do for these intents and subtopics. It helps you decide which actions to automate first for example, “Assisted with payment” or “Set up an online account”.
Automation Potential by Intent Category
The Automation Potential by Intent Category chart helps you to identify which customer intents have the highest potential for automation so you can prioritize automation efforts and improve efficiency. The chart shows interaction volumes for different intent categories and their automation potential.
-
X-axis: It displays intent categories, such as Troubleshooting, Website issues, and Credit or Debit issues. If a label is truncated, hover over it to view the full intent name.
-
Y-axis: It shows the interaction volume. The scale automatically adjusts based on the highest interaction volume in the dataset.
-
Bars represent interaction data:
-
The pink bar shows the total interaction volume for the intent.
-
The green bar shows the volume of interactions that can be automated.
-
The data in this chart is sorted based on the level of automation contributed by each intent to the total annual volume.
-
-
Percentages above green bars indicate the automation potential for each intent. A higher percentage means a greater opportunity for automation.
-
You can hover over any bar to view:
-
Intent name.
-
Total interaction volume.
-
Automation interaction percentage within that intent
-
Automation interaction volume of the total annual interaction
-
Option to Create AI Agent or View Interactions for that intent.
-
-
In all the graphs, click Maximize
 to view the graph in full screen.
How to Interpret the Chart
-
High automation potential (green bar close to pink bar and high percentage): These intents are ideal candidates for automation because most interactions can be automated. Automating these intents will deliver significant efficiency gains.
-
High interaction volume but low automation potential (large pink bar, small green bar): These intents may require more complex handling or involve tasks that cannot be easily automated. Consider partial automation or improving agent workflows for these intents.
-
Low interaction volume but high automation potential: Automating these intents can still improve customer experience and reduce handling time, even if the overall impact on cost savings is smaller.
Automation Opportunity and KPI
Use the Automation Opportunity and KPI chart to analyze which intents offer the best automation opportunities based on key performance indicators (KPIs). This helps you identify areas where automation can improve efficiency and customer experience.
The chart is a bubble plot that shows automation opportunity against average interaction duration.
-
Customer Sentiment is a metric that measures the emotional tone expressed by customers during an interaction. The sentiment bar provides a quick view of customer sentiment for the intents in the chart. It appears as a color-coded horizontal bar with a numeric range. The range determines bubble colors, so colors always reflect relative sentiment within the current view.
-
Avg. Sentiment: It shows the average sentiment score for the selected grouping (Category, Topic, or Subtopic) based on the filter you choose from the drop-down menu. The Min sentiment and Max sentiment values shown in the chart represent the range of sentiment scores for all intents displayed in the current view.
-
Min sentiment: The lowest sentiment score among all intents in the selected grouping (Category, Topic, or Subtopic).
-
Max sentiment: The highest sentiment score among all intents in the selected grouping.
-
-
You can use the drop-down menu to group data by:
-
Category
-
Topic
-
Subtopic
This helps you drill down into specific levels of detail and analyze automation opportunities at different granularity.
-
-
X-axis: Displays Automation Opportunity as a percentage. Higher values indicate greater potential for automation.
-
Y-axis: Displays Average Duration in minutes and seconds (MM:SS). Longer durations suggest more time-consuming interactions that could benefit from automation.
-
Bubbles: Each bubble in the chart represents an intent and provides multiple insights,
-
Bubble size: Indicates interaction volume. Larger bubbles mean higher interaction volume, which suggests greater potential impact if automated.
-
Bubble Color: Represents the sentiment score for that intent.
-
Darker shades = higher sentiment.
-
Lighter shades = lower sentiment.
-
Colors are dynamic and adjust based on the range of sentiment scores in the current view. This means:
-
The system calculates the minimum and maximum sentiment values for all intents displayed.
-
Each sentiment score is normalized to a 0–100%.
-
-
-
This adaptive color coding makes it easy to spot intents with poor sentiment relative to others in the same view.
-
-
When you hover over a bubble you see:
-
Intent name (for example, Payment issue).
-
Average Duration (MM:SS) – for example, 02:34.
-
Automation Opportunity (percentage) – defines the automation interaction percentage within that intent, for example, 60%.
-
Automatable Interactions –defines the automation interaction volume of the total annual interaction, for example, 403.
-
Sentiment score – for example, 9.49.
-
Option to Create AI Agent for that intent.
-
How to Interpret the Chart
-
High automation opportunity (farther right on X-axis): These intents are strong candidates for automation because most interactions can be automated.
-
Long average duration (higher on Y-axis): These intents take more time to resolve, so automating them can significantly reduce handling time and improve efficiency.
-
Bubble color (sentiment):
-
Dark bubbles = automation can still help reduce cost and time.
-
Light bubbles = prioritize these for automation to improve customer experience.
-
-
Bubble size (interaction volume): Larger bubbles represent high-volume intents. Automating these will have the biggest impact on cost savings.
Top 10 Subtopics by Automation Opportunity Chart
The Top 10 Subtopics by Automation Opportunity chart helps you identify which subtopics have the highest automation potential. Use this chart to prioritize automation efforts for specific subtopics that can deliver the greatest efficiency gains.
Subtopics allow you to drill down into detailed customer interactions and identify precise areas for automation. The chart contains:
-
Subtopic-Wise Automation Share (%): This bar is a range indicator that represents the minimum and maximum automation opportunity percentages among the displayed subtopics. It serves as a visual reference scale, helping you to interpret the color gradient applied to individual subtopic bars. It shows,
-
Min: Minimum automation opportunity percentage among subtopics (0%).
-
Max: Maximum automation opportunity percentage among subtopics (100%).
-
Color gradient helps you compare automation potential, darker shades mean higher potential, lighter shades mean lower potential.
-
-
Title: Displays the top 10 subtopics ranked by automation percentage of total volume.
-
Horizontal bars:
-
Each bar represents a subtopic.
-
The length of the bar indicates the automation percentage of the total annual volume. Automation % of Total Annual Volume is the primary metric for ranking. The widget sorts subtopics in descending order of this metric.
-
A value of 100% means all interactions for that subtopic can be automated.
-
The bar color reflects the automation opportunity within the subtopic. Darker bars indicate stronger automation potential within that subtopic.
-
-
Subtopic names: Listed on the left side of the chart (for example, Avail Offers, Sales call, Account closure).
-
Automation share percentage of total volume: Displayed on the right side of each bar (for example, 100%).
-
When you hover over a bar, you see:
-
Subtopic name (for example, Account closure).
-
Number of interactions that can be automated within that intent (for example, 365 out of 365 interactions can be automated).
-
Automation Opportunity within that intent (absolute number and percentage).
-
Automation % of Total Volume (automation potential against the total annual volume, 100%).
-
Option to Create Deterministic Process.
-
How to Interpret the Chart
-
100% automation opportunity: All interactions within that subtopic can be automated. These are ideal candidates for immediate automation.
-
Repeated subtopics: If a subtopic appears multiple times, it may occur in different contexts or categories. Review each instance separately.
Top 15 Actions By Volume Widget
The Top 15 Actions by Volume widget displays the most frequent actions performed by the agent during customer interactions. Use this widget to understand common agent activities and identify opportunities for automation or process improvement.
An action refers to a specific task or step taken during a customer interaction. Actions can include assisting with payments, sending emails, transferring calls, or discussing account details. These actions represent what agents do to resolve customer issues. The widget consists of,
-
Title: Indicates that the widget lists the top 15 actions based on interaction volume.
-
Action list: Displays the names of actions in descending order of frequency. Examples include:
-
Assisted with payment
-
Sending email was discussed
-
Caller was placed on hold
-
Call was transferred
-
-
Scroll bar: Allows you to view all 15 actions if they do not fit in the visible area.
How to Interpret the Widget
-
Actions at the top of the list occur most frequently during interactions.
-
Frequent actions indicate common customer needs or repetitive tasks that may be suitable for automation.
About AI app
An AI app is an automated workflow that represents the steps an AI app takes to handle a specific customer intent or business process. It is designed to mimic the actions of a human agent in a structured, repeatable way. AI Agents are generated from interaction data and automation insights. Each AI app includes:
-
Intent Context – The customer intent or topic the flow addresses (for example, Billing, Refunds, Order Status).
-
Job Description – Provide a description that summarizes the AI Agent’s role in fulfilling the intent, outlining its key responsibilities and tasks.
-
Job Instructions – Provide specific instructions or guidelines that the AI Agent should follow while performing its job.
-
Tools and Parameters – Automation tools, placeholder values, and AI Agents (Cognigy) nodes used to perform tasks.
After review, an AI app can be published to a conversational AI platform, such as AI Agents (Cognigy), for execution in live environments.
To create an AI app, you must have a valid AI Agents (Cognigy) license. This license enables integration with AI Agents (Cognigy)’s conversational automation platform and allows publishing AI Agents.
Create an AI Agent
There are three ways to create an AI app
Create an AI Agent Through the Conversational Panel
-
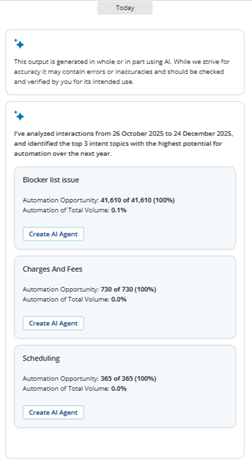
The Automation Opportunity dashboard is populated based on the Analyze Period selected in the User tab of the Settings page.
-
Based on the Analyze Period, the application identifies the top three intent topics with the highest automation potential for the selected period.
-
Each intent appears as an action card in the Conversational Panel, with a Create AI Agent button.
-
In the action card for the intent, you want to automate, click Create AI Agent.
-
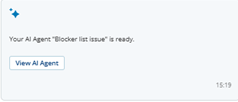
Wait for the confirmation message in the panel: “Your AI Agent <intent> is ready.” Click View AI Agent to open the AI Agent Preview window.
Create an AI Agent Through the Chart Tooltip
You can generate an AI Agent directly from a chart tooltip while exploring automation opportunities. Use either of these charts:
-
Automation Potential by Intent Category (bar chart)
-
Automation Opportunity and KPI (bubble chart)
-
Hover over a bar or bubble in the chart to view details for the intent.
-
When the tooltip opens, review the metrics and select Create AI Agent.
-
In the Conversational Panel on the right, monitor the progress message and wait for the confirmation message in the panel: “Your AI Agent <intent> is ready.”
-
Click View AI Agent to open the AI Agent Preview window.
Create AI Agent Through Natural Language Conversation
To create an AI Agent, you must have the following prerequisites:
-
IA Advanced or IA Premium license
-
Cognigy AI license
-
Company Name
-
Company Description
-
In the Conversational Panel, type your question in natural language, for example, "Create an AI agent for payment inquiries."
-
Press Enter.
-
Wait for the confirmation message in the panel: “Your AI Agent <intent> is ready.” Click View AI Agent to open the AI Agent Preview window.
View AI Agent Details
-
When the Conversational Panel displays “Your AI Agent <intent> is ready” action card, click View AI Agent.
-
In the AI Agent Preview review:
-
Intent Name
-
AI Agent
-
Project Name
-
Sections per agent role, such as:
-
Job Description
-
Job Instruction
-
Tool – 1, Tool – 2, … (each shows Tool Name, Description, Parameters, Placeholder Value, and mapped AI Agents (Cognigy) Nodes)
-
-
-
Click the
 icon to collapse and expand job detail sections.
Edit an AI Agent
-
In the AI Agent Preview panel, click the
 icon. The fields become editable.
 -
Edit the fields as appropriate and click Save. The application displays AI Agent Changes Saved confirmation message.
-
You can edit the following fields only,
-
Agent Name
-
Job Description
-
Tool Name
-
Tool Description
-
Publish an AI app to AI Agents (Cognigy)
-
You must have the API key set up in the User tab of the Settings page. This key enables secure integration with AI Agents (Cognigy) and is required for publishing AI Agent. For details, refer to the Settings topic.
-
A project must already exist in AI Agents (Cognigy) and be visible in the Project Name dropdown menu.
-
You must have publish permissions for that project.
-
Open AI Agent Preview.
-
In Project Name, select the target project (for example, Project A).
-
Review the generated content and click Publish to Cognigy AI.
-
Confirm the success message in the Conversational Panel, for example: “The AI Agent ‘Patrick Goodwin’ for intent ‘Billing’ has been published to Cognigy AI under project ‘Project A’."
-
The selected AI Agent is deployed to the chosen AI Agents (Cognigy) project.
If there is no available AI Agents (Cognigy) project, the preview shows disabled publish action and a warning.
View Sample Interactions Through the Chart Tooltip
You can view interactions directly from a chart tooltip while exploring automation opportunities. You can use the Automation Potential by Intent Category (bar chart) or Top 10 Subtopics By Automation Opportunity to access these interactions.
The purpose is to display sample interactions for each intent level, giving you a clear understanding of the underlying conversations driving each category.
-
Hover over a bar in the chart to view details for the intent.
-
When the tooltip opens, review the metrics and select View Interactions.The application displays Sample Interactions window containing list of interactions for that intent.
-
Click the
 icon next to the interaction you want to play. The application opens the CXone Player to play the interaction.
 -
To learn about the features and capabilities of the CXone Player, refer to the View and Play Interactions topic.
Deterministic Process
A deterministic process is an automated sequence of steps that performs a specific business process or task. In the Automation Opportunity dashboard, deterministic processes help streamline repetitive actions by using predefined logic.
Each deterministic process is tied to a specific intent (subtopic), for example, Making a payment, Verifying payment status, and so on. You can create deterministic process from chart tooltips or natural language requests in the Conversational Panel.
Deterministic process automate discrete tasks or processes, while AI Agents represent a more comprehensive automation path that mimics a human agent’s role, including job descriptions, instructions, and multiple tools.
-
While deterministic processes are being created, you can continue asking other natural language questions in the Conversational Panel.
-
If you request more than three deterministic process, the system queues them and processes them in order. The panel displays status updates for each deterministic process.
Create Deterministic Process Through the Chart Tooltip
You can create deterministic process for an intent(subtopic) directly from the Use the Top 10 Subtopics by Automation Opportunity chart tooltip while exploring automation opportunities.
-
Hover over a bar in the chart to view details for the intent.
-
When the tooltip opens, review the metrics and select Create Deterministic Process.
-
In the Conversational Panel on the right, monitor the progress message and wait for the confirmation message in the panel: “Deterministic Process Completed . Name: <intent>.”
-
Click View Deterministic Process to open the Deterministic Process Preview window.
Create Deterministic Process Through the Conversational Panel
-
In the Conversational Panel, type your question in natural language, for example, "Create a Deterministic Process for Getting Flight Details."
-
Press Enter.
-
Monitor the progress message and wait for the confirmation message in the panel: - “Deterministic Process Completed. Name: <intent>.” In this case, it would be Deterministic Process Completed Name: Getting Flight Details.
View Deterministic Process Details
-
When the Conversational Panel displays “Your Deterministic Process <intent> is ready” action card, click View Deterministic Process.
-
In the Deterministic Process Preview review:
-
Intent Name
-
Deterministic Process Name
-
Project Name
-
Description
-
Purpose
-
Sub-Flows Created
-
Publish Deterministic Process to AI Agents (Cognigy)
-
You must have the API key set up in the User tab of the Settings page. This key enables secure integration with AI Agents (Cognigy) and is required for publishing deterministic process. For details, refer to the Settings topic.
-
A project must already exist in AI Agents (Cognigy) and be visible in the Project Name dropdown menu.
-
You must have publish permissions for that project.
-
Open Deterministic Process Preview.
-
In Project Name, select the target project (for example, Project A).
-
Review the generated content and click Publish to Cognigy AI.
-
Confirm the success message in the Conversational Panel, for example: “The Deterministic Process for intent ‘Billing’ has been published to Cognigy AI under project ‘Project A’."
-
The selected deterministic process is deployed to the chosen AI Agents (Cognigy) project.
If there is no available AI Agents (Cognigy) project, the preview shows disabled publish action and a warning.
Ask Natural Language Questions on Automation Opportunity Data
You can use the Conversational Panel to ask natural-language questions about your Automation Opportunity data, such as top intents by automation potential, estimated ROI, or volume savings, and get concise, actionable textual insights. This helps you discover opportunities quickly without manually scanning multiple charts. You can questions in the following categories:
-
Automation Opportunity, for example, "What’s our biggest automation opportunity and ROI?"
-
Create AI Agent, for example, "Create an AI agent for payment inquiries."
-
Data Questions from Insights, for example, "Show me inbound vs outbound automation opportunities."
You can continue asking questions while creating a workflow. The conversational panel also allows you to scroll through your conversation history, organized with timestamps and date separators such as Today, Yesterday, and more.
The Conversational Panel does not support questions or actions related to:
-
Knowledge Generation
-
Knowledge Generation Manipulation
-
Editing an Email
Suggested Questions
You can quickly access a list of suggested questions by clicking the icon in the conversational panel. Examples of suggested questions include:
-
What are the top 3 intents I should automate immediately?
-
What’s our biggest automation opportunity and what’s the ROI?
-
Which intent should I automate first for maximum impact?
-
Show me inbound vs outbound automation opportunities.