

The Test Suite in AI Studio lets you test and validate how Automated Summary (AutoSummary) performs against real interaction transcripts before those changes go live. Instead of modifying a Copilot profile and waiting for live interactions to judge the output quality, you import transcripts into a test session, run the Automated Summary (AutoSummary) model against them, and immediately review the generated summaries side-by-side.
This is the safest way to tune and validate prompt changes, profile configurations, and LLM model selections. It removes guesswork and gives you evidence-based confidence that your Automated Summary (AutoSummary) configuration will perform as expected in production.
A Test Suite session for Autosummary lets you:
-
Select the flow and profile: Choose the Autosummary flow and the Copilot profile whose prompt and settings you want to test.
-
Load transcripts: Add transcripts by importing from previously stored transcripts.
-
Run analysis: Send the transcripts through the Automated Summary (AutoSummary)model and LLM defined in your selected profile.
-
Review results: See the generated summary for each transcript alongside a quality score and any flagged issues.
-
Reanalyze: Re-run analysis on selected transcripts after making changes to your profile or prompt, without having to rebuild the session.
Create and Manage Sessions
Sessions help you organize and manage your test activities in a structured way. Each session acts as an independent workspace where you can configure test settings, upload queries, and run analysis without affecting other sessions. You can create multiple sessions to separate experiment types, flows, or Copilot profiles, and use session options to rename, review history, or delete sessions as needed.
This topic explains how to create a new session and how to manage it using the available session options.
Create New Session
Creating a new session allows you to start a fresh workspace for running tests without affecting your existing configurations.
A new session is always added to the bottom of the Sessions list.
-
Click the app selector
 go to General and select AI Studio.
 -
Inside AI Studio, select Test Suite.
-
In the Sessions panel, hover over the flow group name, for example, KB Knowledge.
-
Click the plus (+) icon next to the flow group name.
-
A new session labeled New Session appears at the bottom of the list.
-
Click the session to open it and begin configuring your test settings.
Manage Session
Each session includes a menu that allows you to manage and organize your testing work. Using the session options menu, you can quickly rename sessions for clarity, review their activity history, or delete sessions that are no longer needed. These options ensure that your testing environment stays clean, structured, and aligned with your workflow.
-
Hover over the session name in the Sessions panel.
-
Click the More Options
 menu that appears next to the session.
 -
Select one of the available actions: History, Rename, and Delete.
View Session History
The History option displays a chronological list of previous session versions. Each version includes a timestamp, allowing you to track changes or refer back to earlier test configurations. For example:
v.3 — Dec 16, 2025 09:48 PM
v.2 — Dec 15, 2025 03:25 PM
v.1 — Dec 10, 2025 05:20 PM
Use this list to review how the session has evolved over time or access previous states if needed.
Rename Session
Use the Rename option to give the session a more meaningful or descriptive name. To rename a session:
-
Click Rename from the session options menu.
-
A Rename dialog opens.
-
Enter the new session name in the text field. You must enter 1–100 characters.
-
Click Rename to save the updated name, or Cancel to exit without making changes.
Delete Session
Use the Delete option to permanently remove a session you no longer need. To delete a session:
-
Click Delete from the session options menu.
-
A Confirm Deletion dialog appears. It asks: “Are you sure you want to delete <Session Name>?”
-
Click Continue to permanently delete the session, or Cancel to close the dialog without deleting it.
Deleted sessions cannot be restored, so be sure the session is no longer required before confirming.
Once the session is set up, you can upload the queries and their expected responses—either manually or through a file—so the system has the data it needs to evaluate.
Upload Transcript to Test
The Input Data panel defines what autosummary configuration is being tested and which transcript the test targets.
-
Click the app selector
go to select AI Studio. -
Inside AI Studio, select Test Suite.
-
The Sessions pane opens and displays all available sessions. Select the session you want to work in.
All changes and results are saved to the selected session.
-
In the Input Data section, configure the information used for testing:
-
From Select Flow, choose the Autosummary flow you want to evaluate.
-
From Select Prompt Editor Profile, choose the prompt profile you want to use for the test.
-
-
To add transcripts click + Select and Add Interactions. The Transcripts Overview dialog opens, displaying a searchable, selectable list of available transcripts.
-
In the Transcripts Overview browse or search the list to find the transcripts you want to add. Use the search bar at the top of the dialog to filter by name, number, skill, text, or ID.
-
Select the checkbox next to each transcript you want to include in the session. You can select multiple transcripts at once.
-
When you have made your selections, click Import in the dialog.
The selected transcripts are added to the Transcripts panel. Each one appears as a separate row.
-
-
After uploading transcripts, click Analyze. A message appears indicating that the process will take time.
-
When prompted, click Continue to begin the analysis.
View and Manage Transcripts
This topic allows you to review and delete individual transcripts that you upload or add in a session. You can view transcript details either from the transcript table or from the transcript panel, and both locations use the same action to open the full transcript detail. This helps you verify test data, update expected responses, correct errors, and maintain accurate inputs before running or reanalyzing tests.
View Transcript Detail
You can view full transcript details from two places:
-
In the Transcript Panel (before running results)
-
In the Transcript Table on the Test Analysis Results page
The procedure is the same in both locations.
-
Locate the transcript in the Transcript list.
-
Click the
 icon next to the query.
 -
The Summary panel opens on the right side of the screen.
-
In the Transcript Panel, for the transcript that is not analyzed, you can review the following information:
-
Transcript
-
Expected Summary
-
-
In the Transcript Table, for the transcript that is analyzed, you can review the following information:
-
Transcript
-
Expected Summary
-
Performance Metrics
-
Source content retrieved during the run
You can scroll through the panel to view all details.
-
Delete Transcript
-
In the Summary panel, click the More Options
menu. -
Click Delete. A confirmation dialog appears.
-
Click Continue to delete the transcript, or Cancel to go back without deleting.
Deleted transcripts are removed from the session and cannot be recovered.
After the inputs are in place, you analyze the transcripts to see how well the Copilot performed, and the Test Suite generates insights that highlight accuracy levels, mismatches, and areas that may need refinement.
Review Test Results
The Test Analysis Results page helps you evaluate how well the Copilot generated summaries for your test transcripts. After you run an analysis, this page shows metric-based scores, key insights, and detailed results for each transcript. Use these results to understand overall summary quality, identify transcripts that need review, and determine whether prompt, profile, or model adjustments may improve performance.
The Test Analysis Results page helps you evaluate how the copilot responded to your test transcripts. After you run an analysis, this page shows metric‑based scores, key insights, and detailed results for each transcript. Use this feature to understand overall performance, identify strengths and weaknesses, and determine what adjustments may improve summary quality.
The page then displays a visual summary, detailed insights, and a breakdown of results per transcript. Before you begin make sure you have, run an analysis from the Test Suite page.
The application compares the generated summaries with the expected summaries and assigns scores based on these metrics:
-
Summary Relevancy
-
Context Usefulness
-
Faithfulness
The page then displays visual summaries and insights to help you interpret the results and guide next steps.
Understand Test Analysis Results
Before following the steps below, make sure you have completed all instructions in the Upload Transcript for Test topic. The final step in that process is to review your queries and click Continue.
After you click Continue, the system runs the analysis and opens the Test Analysis Results page. Follow the steps below to review and interpret the results.
-
General Information
-
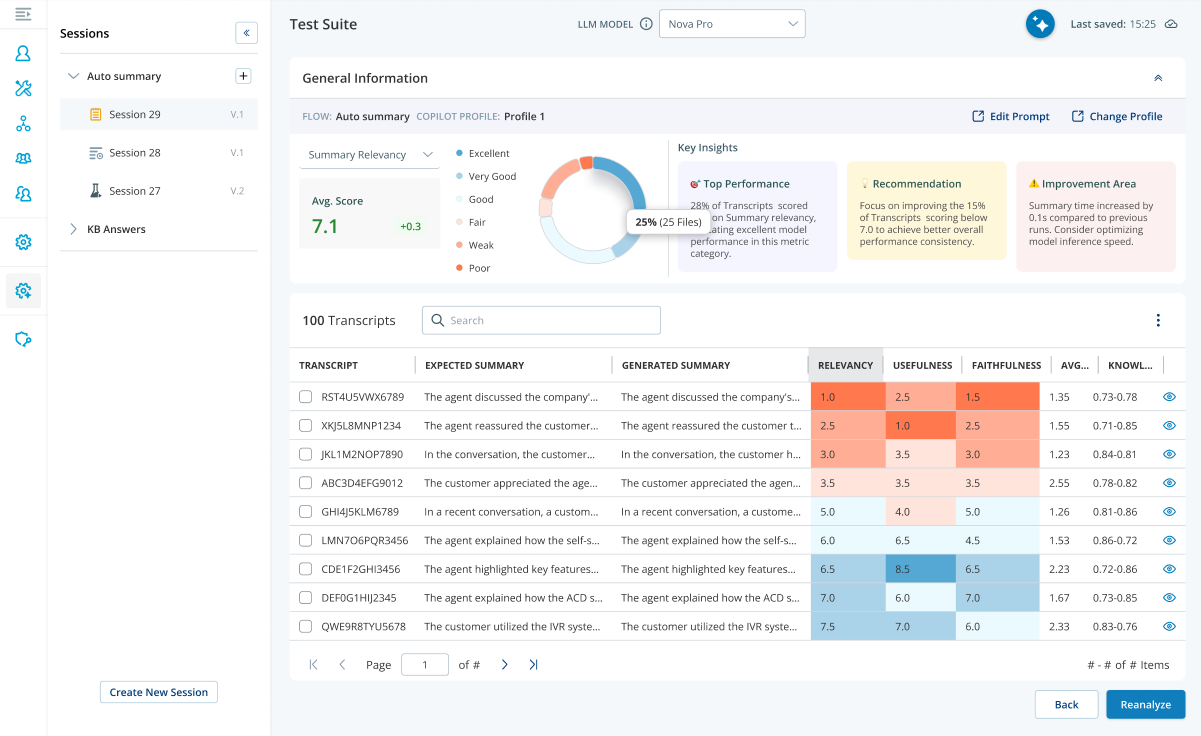
The General Information bar appears at the top of the page and confirms the configuration used for the analysis.
-
Flow field displays Auto summary, indicating that the test evaluates generated summaries.
-
Copilot Profile shows the profile that was active during the analysis (for example, copilot_kh). This helps you confirm which settings and instructions governed the run.
-
Edit Prompt opens the prompt that the copilot used. You can review or adjust instructions and then rerun the analysis.
-
Change Profile lets you select a different copilot profile so you can compare performance under alternate settings with the same transcripts.
These details help you verify that you are reviewing the correct run and ensure that subsequent changes target the right configuration.
-
-
Metric Selector and Score Visualization
-
On the left, the metric selector allows you to switch the evaluation focus. You can select Summary Relevancy, Context Usefulness, or Faithfulness. When you choose a metric, the circular score visualization and the Key Insights cards update to reflect the selected perspective.
-
The circular score visualization summarizes overall performance for the chosen metric. It uses a labeled color scale—Poor, Weak, Fair, Good, Very Good, and Excellent—to place the average score in a familiar range. This visualization helps you understand at a glance whether performance is acceptable or requires attention before you dive into individual results.
-
-
Keys Insights
The Key Insights section provides a quick summary of the Auto Summary test results. It helps you understand the main findings from the analysis without reviewing each transcript individually.
-
The Top Performance card highlights the areas where the generated summaries performed well. For example, it can show that a high percentage of transcripts received strong scores for the selected metric. This helps you identify where the summary generation is working as expected. For Auto Summary, this can indicate that the generated summaries are relevant, useful, or faithful to the transcript content.
-
Recommendation card provides suggested actions based on the analysis results. These recommendations help improve the quality and consistency of generated summaries. For example, the system may recommend reviewing low-scoring transcripts, refining the prompt, or checking whether the expected summaries are complete and accurate. Use this card to decide what action to take before running another analysis.
-
Improvement Area card identifies the parts of the results that need attention. For Auto Summary, this can include transcripts with low scores, summaries that missed important details, summaries that included unsupported information, or cases where summary generation took longer than expected. Use this card to identify issues that may require prompt updates, profile changes, or transcript review.
These insights explain not only what the scores are but also why you saw those results and what to do next.
-
-
Transcript Level Results
-
The Transcript Results table displays detailed evaluation results for each transcript included in the Auto Summary test run. Use this table to compare the expected summary with the generated summary and understand how each transcript performed.
-
The Transcript column displays the unique transcript ID. Use this ID to identify the transcript that was analyzed.
-
The Expected Summary column displays the reference summary provided for the transcript. This summary is used as the benchmark for evaluating the generated summary.
-
The Generated Summary column displays the summary created by the system for the transcript. Compare this summary with the expected summary to check whether the system captured the required information.
-
The Relevancy column displays how closely the generated summary matches the important information in the transcript and expected summary.
-
The Usefulness column displays how helpful, complete, and meaningful the generated summary is for the user.
-
The Faithfulness column displays whether the generated summary accurately represents the transcript without adding unsupported or incorrect information.
-
The Average Score column displays the overall score for the transcript. This score is calculated from the available evaluation metrics and helps you quickly identify high-performing and low-performing transcripts.
Use the table to review each transcript result individually. For transcripts with low scores, compare the expected summary and generated summary to identify missing details, irrelevant information, incomplete summaries, or unsupported statements.
-
Understanding the Metrics
These metrics use a LLM model‑based evaluation technique that scores each response based on the transcript and the knowledge content retrieved during the run. The scores provide helpful guidance when assessing accuracy, but they may not always be fully precise.
-
Summary Relevancy: It measures how closely the generated summary reflects the important information from the transcript and aligns with the expected summary. A high relevancy score indicates that the summary includes the key points from the transcript, matches the intent and focus of the expected summary, and contains minimal irrelevant or unnecessary details. A low relevancy score may indicate that important information from the transcript is missing, the summary includes unrelated or less important details, or the focus of the summary does not match the expected outcome.
-
Context Usefulness: It measures how helpful and complete the generated summary is for the intended purpose. A high usefulness score indicates that the summary is clear, structured, and easy to understand, provides sufficient detail to be actionable or informative, and presents key information in a way that supports decision-making or quick understanding. A low usefulness score may indicate that the summary is incomplete or lacks important details, the content is unclear, poorly structured, or difficult to interpret, or the summary does not effectively serve its intended purpose.
-
Faithfulness: It measures whether the generated summary accurately represents the transcript without introducing incorrect or unsupported information. A high faithfulness score indicates that all statements in the summary are grounded in the transcript, no additional or fabricated information is introduced, and the meaning of the original content is preserved. A low faithfulness score may indicate that the summary includes information not present in the transcript, contains incorrect or misinterpreted details, or distorts the original meaning of the transcript.
View Performance Reasoning
View Performance Reasoning to understand why the application assigned specific metric scores to the generated output. Performance reasoning highlights the factors that influenced each result so you can review evaluator logic, identify strengths and weaknesses, and improve your configuration, content, prompts, or retrieval settings. Use performance reasoning to:
-
Investigate unexpectedly low scores
-
Compare metrics across similar queries or summaries
-
Understand why a correct output received a low score
-
Review insights before refining prompts or configuration settings
-
Verify whether retrieval or grounding affected the generated output
To View Performance Reasoning do the following,
-
In the Transcript Table, locate the transcript you want to review.
-
Click the
icon next to the transcript. -
The Summary panel opens on the right side of the screen.
-
Click the dropdown next to View Performance Reasoning to expand the detailed narrative.
-
A detailed explanation appears, showing the evaluator’s analysis for the selected transcript.
Reasoning Content
The reasoning content is divided into structured sections designed to help you quickly understand the scoring outcome:
- Analysis & Observations: This section outlines,
Key factors the evaluator considered
How the generated output compared to the expected response or summary
Whether critical elements were included, missing, or misinterpreted
Confidence signals derived from retrieved knowledge sources
The narrative highlights where the generated output did well and where its understanding diverged from expectations.
-
Scoring Rationale:This part describes the specific logic behind the metric scores, including,
-
Relevancy — how closely the generated output addressed the query intent
-
Context Precision — whether details were accurate, complete, and grounded in retrieved source content
-
Faithfulness — whether the generated output remained consistent with approved source material
The reasoning ties each score directly to observable behaviors in the generated output.
-
-
Recommendations for Improvement: When the evaluator identifies improvement areas, the reasoning includes targeted guidance such as,
-
Clarifying or restructuring expected responses or summaries
-
Improving KB article quality (missing information, inconsistent terminology, outdated content)
-
Enhancing Copilot instructions or adjusting the prompt
-
Improving query phrasing or separating multi‑intent questions
These recommendations help you make actionable updates before reanalyzing the query.
-
-
Error or Failure Insights (if applicable): If the generated ouptut contains inconsistencies or unsupported claims, this section explains,
-
Which parts deviated from the knowledge base
-
Where hallucinations may have occurred
-
Why certain details were flagged as incorrect
This allows you to correct the underlying KB or prompt behavior.
-
How to Interpret the Results Overall
Use the Test Analysis Results page to evaluate overall summary performance across all transcripts and identify areas that require improvement.
Start by reviewing the Average Score for each metric. A higher average score indicates better overall performance. Compare the scores across Relevancy, Usefulness, and Faithfulness to understand whether the summaries are accurate, helpful, and aligned with the expected output.
Next, review the Score Distribution to understand how consistently the summaries perform. A higher number of transcripts in the Excellent and Very Good ranges indicates stable performance, while a wider spread across lower ranges such as Fair, Weak, or Poor indicates inconsistency.
Check the Key Insights section to identify major patterns in the results. Use the Top Performance insight to understand strengths, and review the Recommendation and Improvement Area insights to identify actions needed to improve results.
Review the Transcript Results table to analyze individual transcripts. Focus on transcripts with low scores and compare the expected and generated summaries to identify issues such as missing information, irrelevant details, or unsupported content.
When interpreting the results, consider all metrics together. High relevancy with low faithfulness may indicate incorrect information, while high faithfulness with low usefulness may indicate incomplete summaries.
Use the results to decide whether to update the prompt, change the Copilot profile, or refine the test data. After making changes, run the analysis again to compare results and measure improvement.
Reanalyze Test Queries
The Reanalyze feature allows you to run the analysis again on the same dataset within a session. You can reanalyze in these supported scenarios:
Update the Prompt Using the Prompt Editor
Follow these steps when you want to modify the system prompt used by the Copilot:
-
On the Test Analysis Results page, click the Prompt Editor button. The prompt opens in the GenAI Prompts.
-
In the GenAI Prompts, review and update the prompt text as needed.
-
After editing the prompt, select Save to apply the changes.
-
Return to your Test Suite session.
-
In the Transcript table, select All to choose every query, or select individual checkboxes to reanalyze only specific transcripts.
-
Select Reanalyze at the bottom right of the page. The system processes the selected queries and refreshes the results.
Reanalyze uses the same dataset, so do not modify your transcripts if you want accurate comparison results.
When processing is complete, the score visualization, Key Insights, and transcript-level results update with the new data.
Re-running Failed Records
Sometimes during analysis, one or more transcripts may fail to process due to temporary system issues such as timeouts or backend errors. In these cases, the Test Suite marks the affected transcripts with missing generated responses or “N/A” metrics. Instead of running the entire dataset again, you can simply reanalyze these failed records. This allows the system to retry only the problematic transcripts, helping you complete the analysis without reprocessing all test data. Re-running failed records is especially helpful when only a small number of items were affected by temporary errors and you want to fill in the missing outputs efficiently.
Verifying Consistency Over Time Using the Same Dataset
You can reanalyze your dataset to verify consistency over time, especially after back-end updates or system changes. In this scenario, you do not modify your queries or expected responses. Instead, you re-run the analysis with the same dataset to confirm that your Copilot continues to behave as expected. This is useful after infrastructure updates, model upgrades, or deployment changes that might influence response quality. By comparing the new results with previous runs, you can detect potential regressions, confirm stability, and ensure that your Copilot performs consistently across different system versions.
Export Results
You can export your analysis results to CSV so you can share them, post‑process them in BI tools, or archive them outside the application. When you export, the application generates a ZIP archive that contains two separate CSV files:
-
Key insights and recommendations: This file includes the high‑level outcome of the analysis, for example:
-
Overall results per metric for example, containment, faithfulness, precision, relevancy and so on.
-
Key insights detected by the analysis
-
Recommendations for improving the configuration, content, prompts, or generated output behavior
Use this file when you want a quick, summarized view of performance and suggestions.
-
-
Detailed results table data: This file includes the detailed row‑level data from the results table, such as:
-
Flow name, session name, and version
-
Query, input, or summary text and associated metadata
-
Metrics for each row, such as success, containment, sentiment, faithfulness, precision, or relevancy
-
Analysis status for each row
-
If an item was not analyzed, it is still included in this file. Its metric values are marked as NA so you can clearly see that no metrics are available for that row.
-
You can also export sessions that have only prepared data and no analysis yet. In that case, the file contains the prepared table data with metrics marked as NA where appropriate.
To export the test analysis results do the following:
-
On the Test Analysis Results page, go to results table, and click the
 icon. The application exports ZIP archive that contains two separate CSV files.