

The Test Suite provides a structured way to evaluate the performance of your Copilot’s Knowledge Base (KB) powered responses. Currently, supported exclusively for KB Knowledge, it allows you to validate how well your Copilot retrieves and uses information from your knowledge base when answering real user queries. By uploading queries along with their expected responses, you can review, edit, and manage each entry within a session before running an analysis.
The Test Suite then compares the Copilot’s actual responses with your expected outputs, offering insights into accuracy, gaps, and areas for improvement—helping you ensure your KB-driven Copilot becomes more consistent, reliable, and aligned with your intended knowledge experience.
Create and Manage Sessions
Sessions help you organize and manage your test activities in a structured way. Each session acts as an independent workspace where you can configure test settings, upload queries, and run analysis without affecting other sessions. You can create multiple sessions to separate experiment types, flows, or Copilot profiles, and use session options to rename, review history, or delete sessions as needed.
This topic explains how to create a new session and how to manage it using the available session options.
Create New Session
Creating a new session allows you to start a fresh workspace for running tests without affecting your existing configurations.
A new session is always added to the bottom of the Sessions list.
-
Click the app selector
 go to General and select AI Studio.
 -
Inside AI Studio, select Test Suite.
-
In the Sessions panel, hover over the flow group name, for example, KB Knowledge.
-
Click the plus (+) icon next to the flow group name.
-
A new session labeled New Session appears at the bottom of the list.
-
Click the session to open it and begin configuring your test settings.
Manage Session
Each session includes a menu that allows you to manage and organize your testing work. Using the session options menu, you can quickly rename sessions for clarity, review their activity history, or delete sessions that are no longer needed. These options ensure that your testing environment stays clean, structured, and aligned with your workflow.
-
Hover over the session name in the Sessions panel.
-
Click the More Options
 menu that appears next to the session.
 -
Select one of the available actions: History, Rename, and Delete.
View Session History
The History option displays a chronological list of previous session versions. Each version includes a timestamp, allowing you to track changes or refer back to earlier test configurations. For example:
v.3 — Dec 16, 2025 09:48 PM
v.2 — Dec 15, 2025 03:25 PM
v.1 — Dec 10, 2025 05:20 PM
Use this list to review how the session has evolved over time or access previous states if needed.
Rename Session
Use the Rename option to give the session a more meaningful or descriptive name. To rename a session:
-
Click Rename from the session options menu.
-
A Rename dialog opens.
-
Enter the new session name in the text field. You must enter 1–100 characters.
-
Click Rename to save the updated name, or Cancel to exit without making changes.
Delete Session
Use the Delete option to permanently remove a session you no longer need. To delete a session:
-
Click Delete from the session options menu.
-
A Confirm Deletion dialog appears. It asks: “Are you sure you want to delete <Session Name>?”
-
Click Continue to permanently delete the session, or Cancel to close the dialog without deleting it.
Deleted sessions cannot be restored, so be sure the session is no longer required before confirming.
Once the session is set up, you can upload the queries and their expected responses—either manually or through a file—so the system has the data it needs to evaluate.
Upload Queries and Responses to Test
This topic guides you through preparing the data required for evaluating copilot responses. Whether you want to upload a file containing multiple test cases or manually enter individual queries, this section provides step‑by‑step instructions. You will also select the flow and copilot profile that the system uses during analysis
You can upload only queries or upload both queries and expected responses. For best test results, it’s recommended to provide both.
-
Click the app selector
go to General and select AI Studio. -
Inside AI Studio, select Test Suite.
-
The Sessions pane opens and displays all available sessions. Select the session you want to work in.
All changes and results are saved to the selected session.
-
In the Input Data section, configure the information used for testing:
-
From Select Flow, choose the flow you want to evaluate.
Only the KB Knowledge flow is currently supported.
-
From Select Copilot Profile, choose the copilot profile you want to use for the test.
-
-
You can add queries and responses manually or by uploading a file that contains the list of queries and responses.
-
Upload a file:
-
Under Upload File, select Browse to choose a file, or drag and drop the file into the upload area.
-
Click Upload.
-
Use CSV with headers Query and Expected Response.
-
Verify there are no blank header names or extra columns.
-
If the upload fails, check the file type, encoding, and required headers.
-
-
-
Add manually:
-
In the Queries panel, select Add.
-
In the Response panel that opens, enter the Query and Expected Response
Make sure you enter both the Query and the Expected Response to get the best analysis results.
-
Click Save to add the query to the session.
-
-
-
You can review your dataset by viewing, editing, or deleting individual queries and expected responses until you’re satisfied with the final test set.
-
After adding or uploading queries, click Analyze. A message appears indicating that the process will take time.
-
When prompted, click Continue to begin the analysis.
View and Manage Queries
This topic allows you to review, edit, and delete individual queries that you upload or add in a session. You can view query details either from the Query table or from the Query panel, and both locations use the same action to open the full query detail. This helps you verify test data, update expected responses, correct errors, and maintain accurate inputs before running or reanalyzing tests.
View Query Detail
You can view full query details from two places:
-
In the Query Panel (before running results)
-
In the Query Table on the Test Analysis Results page
The procedure is the same in both locations.
-
Locate the query in the Query list.
-
Click the
 icon next to the query.
 -
The Response panel opens on the right side of the screen.
-
In the Query Panel, for the query that is not analyzed, you can review the following information:
-
Query
-
Expected Response
-
-
In the Query Table, for the query that is analyzed, you can review the following information:
-
Query
-
Expected Response
-
Generated Response (shown only after analysis)
-
Performance Metrics
-
Source content retrieved during the run
You can scroll through the panel to view all details.
-
Edit Query
-
In the Response panel, click the More Options
menu. -
Click Edit.
-
The Query and Expected Response,fields become editable.
-
Make the necessary changes and click Save.
Delete Query
-
In the Response panel, click the More Options
menu. -
Click Delete. A confirmation dialog appears.
-
Click Continue to delete the query, or Cancel to go back without deleting.
Deleted queries are removed from the session and cannot be recovered.
After the inputs are in place, you analyze the queries to see how well the Copilot performed, and the Test Suite generates insights that highlight accuracy levels, mismatches, and areas that may need refinement.
Review Test Results
The Test Analysis Results page helps you evaluate how the copilot responded to your test queries. After you run an analysis, this page shows metric‑based scores, key insights, and detailed results for each query. Use this feature to understand overall performance, identify strengths and weaknesses, and determine what adjustments may improve response quality.
The page then displays a visual summary, detailed insights, and a breakdown of results per query. Before you begin make sure you have, run an analysis from the Test Suite page.
The feature currently supports the KB Knowledge flow. Access to AI Studio features may vary depending on your tenant permissions.
The application compares the Copilot’s generated responses with your expected responses and assigns scores based on three metrics:
-
Response Relevancy
-
Context Precision
-
Faithfulness
The page then displays visual summaries and insights to help you interpret the results and guide next steps.
Understand Test Analysis Results
Before following the steps below, make sure you have completed all instructions in the Upload Queries and Responses to Test topic. The final step in that process is to review your queries and click Continue.
After you click Continue, the system runs the analysis and opens the Test Analysis Results page. Follow the steps below to review and interpret the results.
-
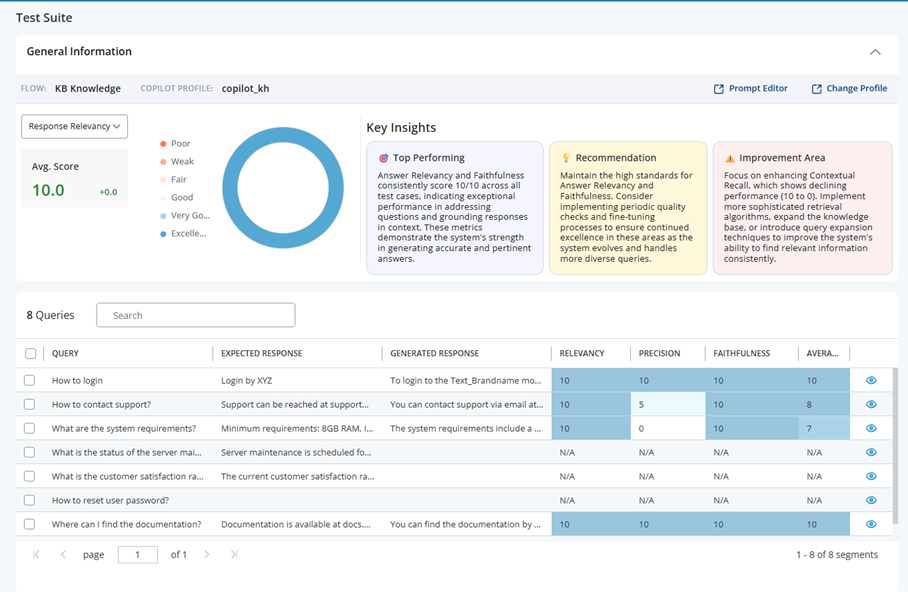
General Information
-
The General Information bar appears at the top of the page and confirms the configuration used for the analysis.
-
Flow identifies the knowledge flow that generated responses. In the current release, the page shows KB Knowledge when you evaluate knowledge‑based answers.
-
Copilot Profile shows the profile that was active during the analysis (for example, copilot_kh). This helps you confirm which settings and instructions governed the run.
-
Prompt Editor opens the prompt that the copilot used. You can review or adjust instructions and then rerun the analysis.
-
Change Profile lets you select a different copilot profile so you can compare performance under alternate settings with the same test queries.
These details help you verify that you are reviewing the correct run and ensure that subsequent changes target the right configuration.
-
-
Metric Selector and Score Visualization
-
On the left, the metric selector allows you to switch the evaluation focus. You can select Response Relevancy, Context Precision, or Faithfulness. When you choose a metric, the circular score visualization and the Key Insights cards update to reflect the selected perspective.
-
The circular score visualization summarizes overall performance for the chosen metric. It uses a labeled color scale—Poor, Weak, Fair, Good, Very Good, and Excellent—to place the average score in a familiar range. This visualization helps you understand at a glance whether performance is acceptable or requires attention before you dive into individual results.
-
-
Keys Insights
-
The Key Insights cards provide concise explanations that translate scores into practical guidance.
-
Top Performing highlights behaviors that consistently worked well during the analysis. For example, you may see that answer relevancy and faithfulness achieved perfect scores, indicating strong question understanding and reliable grounding in approved content.
-
Recommendation suggests specific next steps to maintain or improve performance. You may be advised to fine‑tune retrieval, adjust the prompt, or align profile settings to better use available knowledge.
-
Improvement Area points out patterns where results were weak or inconsistent. You might be directed to strengthen contextual recall, refine content in your knowledge base, or apply techniques such as query expansion, dense retrieval, or re‑ranking to improve identification of relevant sources.
These insights explain not only what the scores are but also why you saw those results and what to do next.
-
-
Query Level Results
-
The lower section of the page lists each test case as a separate row. Every row includes the following information:
-
Query displays the user question you tested.
-
Expected Response contains the answer you provided as the target or benchmark.
-
Generated Response shows the copilot’s actual output during the run.
-
Relevancy, Precision, and Faithfulness display the metric values associated with the selected evaluation perspective. When you switch metrics in the left panel, the emphasis in the table updates accordingly.
-
Average Score summarizes the overall quality for that test case.
-
You can review this table to locate specific queries that underperformed and then determine whether the issue is understanding the intent, retrieving the right content, or grounding the answer in trusted sources.
-
-
Understanding the Metrics
These metrics use a LLM model‑based evaluation technique that scores each response based on the query and the knowledge content retrieved during the run. The scores provide helpful guidance when assessing accuracy, but they may not always be fully precise.
-
Response Relevancy:It measures how relevant it is to the original query. A high relevancy score indicates that the copilot understood the question, addressed the right topic, and produced text that matches the meaning of the target answer. A low score suggests the response missed the point, drifted off topic, or omitted essential elements of the expected answer. You should focus on prompt clarity, profile instructions, and query formulation when relevancy is low.
-
Context Precision: It evaluates how accurately the copilot uses details from relevant sources. A high score means the answer includes correct, specific information and excludes extraneous or incorrect details. A low score indicates the response mixed in imprecise facts, used the wrong figures or terms, or added irrelevant content. You can improve precision by refining the retrieval configuration, cleaning your knowledge sources, and ensuring that key facts are unambiguous and consistently formatted.
-
Faithfulness: It assesses whether the generated response stays grounded in approved and trusted content. A high score means the copilot avoided unsupported claims and did not include unverified facts. A low score indicates the response included information that could not be verified in your sources. You can improve faithfulness by strengthening grounding signals, providing authoritative content, and encouraging the model to cite or rely on identified sources.
View Performance Reasoning
View Performance Reasoning to understand why the application assigned specific metric scores to the generated output. Performance reasoning highlights the factors that influenced each result so you can review evaluator logic, identify strengths and weaknesses, and improve your configuration, content, prompts, or retrieval settings. Use performance reasoning to:
-
Investigate unexpectedly low scores
-
Compare metrics across similar queries or summaries
-
Understand why a correct output received a low score
-
Review insights before refining prompts or configuration settings
-
Verify whether retrieval or grounding affected the generated output
To View Performance Reasoning do the following,
-
In the Query Table, locate the query you want to review.
-
Click the
icon next to the query. -
The Response panel opens on the right side of the screen.
-
Click the dropdown next to View Performance Reasoning to expand the detailed narrative.
-
A detailed explanation appears, showing the evaluator’s analysis for the selected query.
Reasoning Content
The reasoning content is divided into structured sections designed to help you quickly understand the scoring outcome:
- Analysis & Observations: This section outlines,
Key factors the evaluator considered
How the generated output compared to the expected response or summary
Whether critical elements were included, missing, or misinterpreted
Confidence signals derived from retrieved knowledge sources
The narrative highlights where the generated output did well and where its understanding diverged from expectations.
-
Scoring Rationale:This part describes the specific logic behind the metric scores, including,
-
Relevancy — how closely the generated output addressed the query intent
-
Context Precision — whether details were accurate, complete, and grounded in retrieved source content
-
Faithfulness — whether the generated output remained consistent with approved source material
The reasoning ties each score directly to observable behaviors in the generated output.
-
-
Recommendations for Improvement: When the evaluator identifies improvement areas, the reasoning includes targeted guidance such as,
-
Clarifying or restructuring expected responses or summaries
-
Improving KB article quality (missing information, inconsistent terminology, outdated content)
-
Enhancing Copilot instructions or adjusting the prompt
-
Improving query phrasing or separating multi‑intent questions
These recommendations help you make actionable updates before reanalyzing the query.
-
-
Error or Failure Insights (if applicable): If the generated ouptut contains inconsistencies or unsupported claims, this section explains,
-
Which parts deviated from the knowledge base
-
Where hallucinations may have occurred
-
Why certain details were flagged as incorrect
This allows you to correct the underlying KB or prompt behavior.
-
How to Interpret the Results Overall
You should start with the metric that most closely matches your current objective. If you are verifying whether the Copilot understood user intent, you should begin with Response Relevancy. If you are validating factual detail, you should focus on Context Precision. If you are checking for unsupported statements you should review Faithfulness.
Next, you should read the Key Insights to understand patterns across all queries. High‑level patterns often reveal systemic causes such as overly broad prompts, insufficient retrieval recall, or content gaps in the knowledge base.
Finally, you should examine the query‑level results to see exactly which examples drove the scores. You should compare the Generated Response against the Expected Response, and then map the issues you find back to the recommended actions in the Key Insights cards.
Reanalyze Test Queries
The Reanalyze feature allows you to run the analysis again on the same dataset within a session. You can reanalyze in these supported scenarios:
-
After switching to a different Copilot profile or updating the Copilot profile
-
To re-run failed records (system errors or incomplete results)
Update the Prompt Using the Prompt Editor
Follow these steps when you want to modify the system prompt used by the Copilot:
-
On the Test Analysis Results page, click the Prompt Editor button. The prompt opens in the GenAI Prompts.
-
In the GenAI Prompts, review and update the prompt text as needed.
-
After editing the prompt, select Save to apply the changes.
-
Return to your Test Suite session.
-
In the Query table, select All to choose every query, or select individual checkboxes to reanalyze only specific queries.
-
Select Reanalyze at the bottom right of the page. The system processes the selected queries and refreshes the results.
Reanalyze uses the same dataset, so do not modify your queries if you want accurate comparison results.
When processing is complete, the score visualization, Key Insights, and query-level results update with the new data.
Update the Copilot Profile
Follow these steps when you need to update the Copilot configuration used for the test:
-
On the Test Analysis Results page, click the Change Profile button. The application opens the Copilot for Agents configuration page.
-
In the Profiles page, review and update the Copilot profile as needed.
-
Click Save to apply your updates to the profile.
-
Return to your Test Suite session.
-
In the Query table, select All to choose every query, or select individual checkboxes to reanalyze only specific queries.
-
Select Reanalyze at the bottom right of the page. The system processes the selected queries and refreshes the results.
Reanalyze uses the same dataset, so do not modify your queries if you want accurate comparison results.
When processing is complete, the score visualization, Key Insights, and query-level results update with the new data.
Creating and Updating KB Article
You can create, edit, and publish knowledge articles in the CXone Knowledge Management (Expert) Knowledge Base. Articles can be published as Draft or Live, exported for offline use, and edited using AI or manual options.
-
In the Response panel, click + Create an Article in KB. The application generates an article using available sources based on the query or context.
-
To publish the article, in the Knowledge Article pop-up window click the Publish menu and choose one of the following options:
-
CXone Export - Live: Publishes the article as a live version in CXone Expert.
-
CXone Export - Draft: Publishes the article as a draft for review.
-
Export Document: Downloads the article for offline use.
-
-
You have multiple options to refine the article:
-
Edit with AI: Click the Pixie icon
 to apply AI-powered enhancements to the article content.
 -
Inline Edit: Click the Edit
 icon ️ to open the article in an inline editor. Make changes directly in the text editor and format as needed.
 -
Conversational Edit: Use the instruction panel on the right side. Type an instruction, for example, “Add a definition for customer satisfaction rating” or “Include bullet points for key factors”. Click Send to apply changes automatically.
-
After editing, click Publish again in the pop-up window to update the article as Draft or Live.
-
Re-running Failed Records
Sometimes during analysis, one or more queries may fail to process due to temporary system issues such as timeouts, backend errors, or incomplete responses. In these cases, the Test Suite marks the affected queries with missing generated responses or “N/A” metrics.
The N/A result indicates that the system was unable to calculate the metric due to an error encountered during analysis. For example, this may occur when the Large Language Model (LLM) returns invalid or unexpected responses for one or more queries, preventing the application from generating reliable performance metrics.
When such errors occur, the application displays N/A instead of a metric value to avoid showing potentially inaccurate results.
Instead of running the entire dataset again, you can simply reanalyze these failed records. This allows the system to retry only the problematic queries, helping you complete the analysis without reprocessing all test data. Re-running failed records is especially helpful when only a small number of items were affected by temporary errors and you want to fill in the missing outputs efficiently.
Verifying Consistency Over Time Using the Same Dataset
You can reanalyze your dataset to verify consistency over time, especially after back-end updates or system changes. In this scenario, you do not modify your queries or expected responses. Instead, you re-run the analysis with the same dataset to confirm that your Copilot continues to behave as expected. This is useful after infrastructure updates, model upgrades, or deployment changes that might influence response quality. By comparing the new results with previous runs, you can detect potential regressions, confirm stability, and ensure that your Copilot performs consistently across different system versions.
Export Results
You can export your analysis results to CSV so you can share them, post‑process them in BI tools, or archive them outside the application. When you export, the application generates a ZIP archive that contains two separate CSV files:
-
Key insights and recommendations: This file includes the high‑level outcome of the analysis, for example:
-
Overall results per metric for example, containment, faithfulness, precision, relevancy and so on.
-
Key insights detected by the analysis
-
Recommendations for improving the configuration, content, prompts, or generated output behavior
Use this file when you want a quick, summarized view of performance and suggestions.
-
-
Detailed results table data: This file includes the detailed row‑level data from the results table, such as:
-
Flow name, session name, and version
-
Query, input, or summary text and associated metadata
-
Metrics for each row, such as success, containment, sentiment, faithfulness, precision, or relevancy
-
Analysis status for each row
-
If an item was not analyzed, it is still included in this file. Its metric values are marked as NA so you can clearly see that no metrics are available for that row.
-
You can also export sessions that have only prepared data and no analysis yet. In that case, the file contains the prepared table data with metrics marked as NA where appropriate.
To export the test analysis results do the following:
-
On the Test Analysis Results page, go to results table, and click the
 icon. The application exports ZIP archive that contains two separate CSV files.