

Quality Management (CXone) (QM) provides flexible tools that help you monitor and improve agent performance.
Using QM, you can build evaluation forms and plans. You can then take the plans and distribute agent interactions for evaluation. Based on the evaluation results, you might decide to design coaching sessions for employees to improve their skills. It's important to note that while some areas of Quality Management (CXone) may display evaluations based on specific time frames, there are no defined rules for how long evaluations must be retained.
Access to Quality Management (CXone) functionality depends on Teams and Groups APIs. To use features across Quality Management (CXone) pages, you must have at least View permission for both Teams and Groups. This applies to pages such as Quality Performance, Forms, Scorecard, Quality Plan, and others. You can verify and manage these permissions under:
Teams (View / Edit / Create / Deactivate)
Groups (View / Edit / Create / Delete)
If the required permissions are not enabled for your role, only the sections of these pages that rely on Teams and Groups data will be restricted or unavailable.
Quality Management Score Metric
Quality managers want to assess agents using the same calculation that their organization uses for performance assessment. The slightest difference in a calculation can affect the outcome.
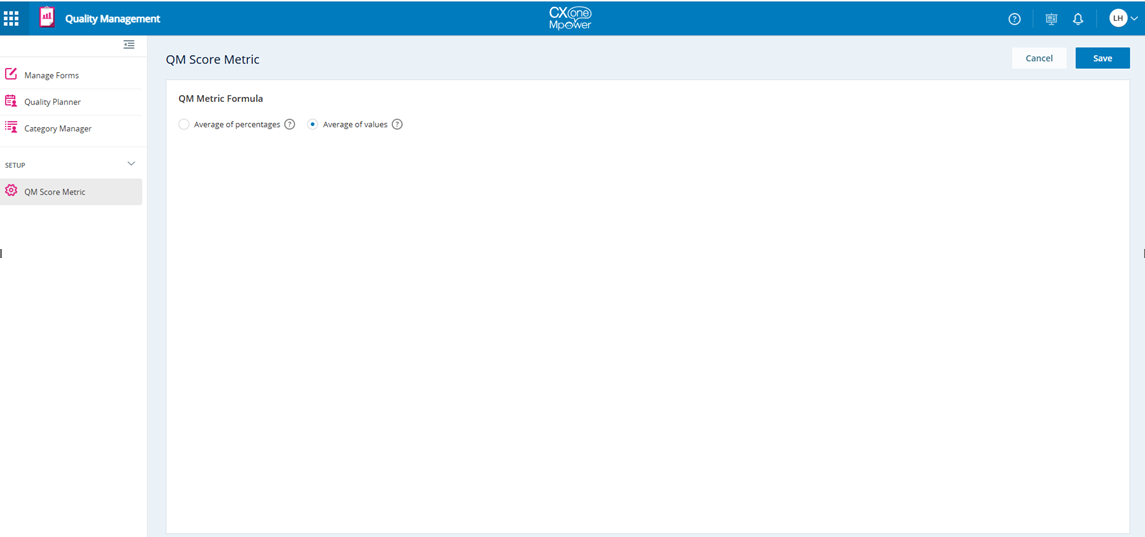
With the Quality Management (CXone) Score Metric, you can see quality scores in every part of Quality Management (CXone). The system uses the points scored or earned when more than one evaluation is in the total. Quality Management (CXone) score metrics can be calculated either as average of the percentage scores, or an average of the actual values.
The formula that Quality Performance uses is controlled with the Quality Management (CXone) Score Metric tab in Quality Management (CXone) tools. This is controlled with specific permission in the security role. Permissions needed Quality Management (CXone) Tools > Average Quality Score Configuration: View/Edit.
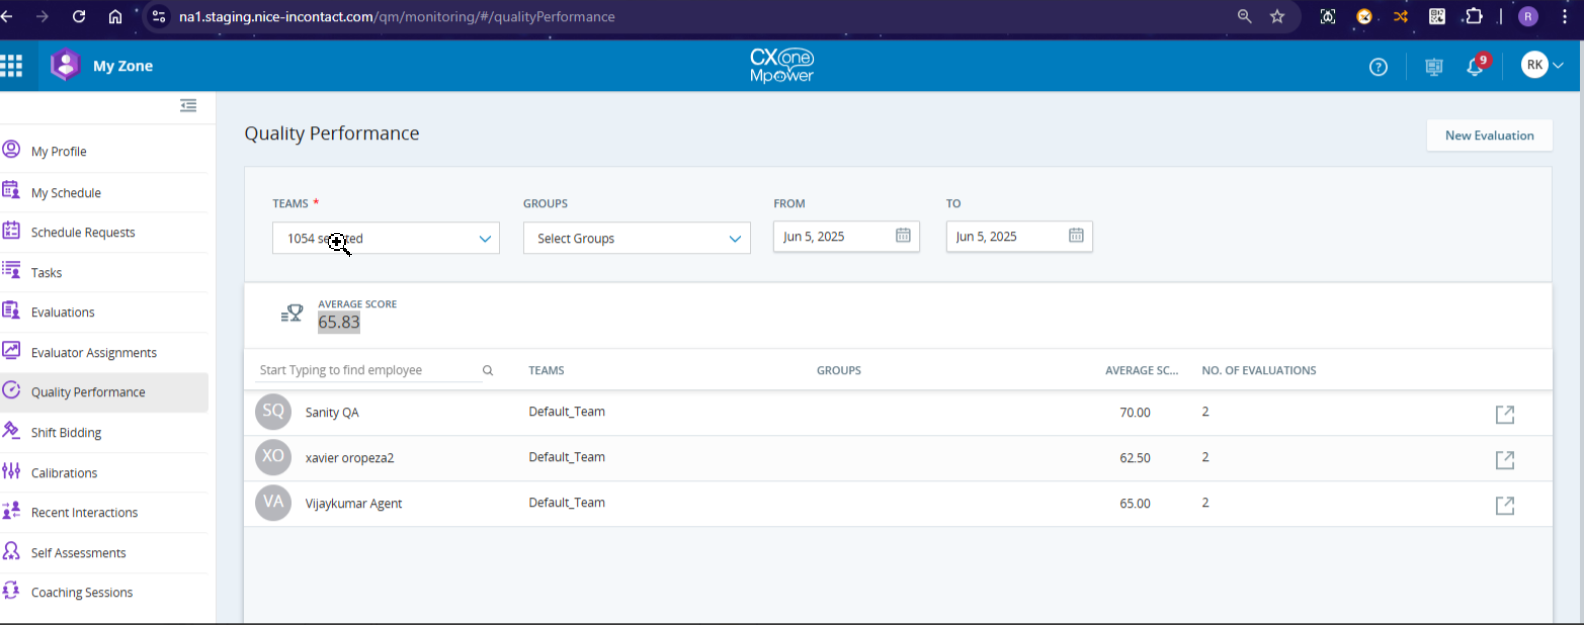
The formula you choose will determine how the average score is displayed to users on the Quality Performance page in My Zone. Each option corresponds to a specific scoring formula, outlined below:
To calculate the average of percentages:
Step 1
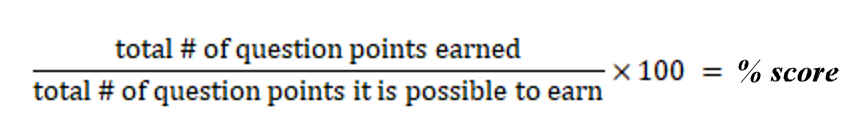
Step 2
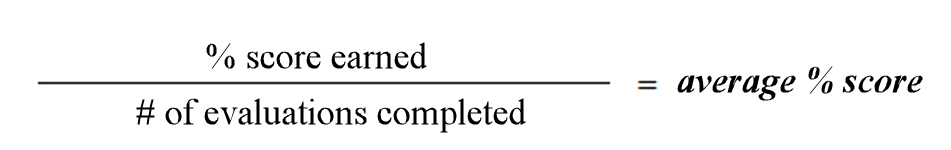
Step-by-step calculation of the average of percentages for each agent based on two evaluations:
| Agent | Value Score | Percentage |
|---|---|---|
| Sanity QA | 3 ÷ 5 x 100 | 60% |
| 8 ÷ 10 x 100 | 80% | |
| Xavior | 3 ÷ 4 x 100 | 75% |
| 5 ÷ 10 x 100 | 50% | |
| Vijay | 3 ÷ 3 x 100 | 100% |
| 3 ÷ 10 x 100 | 30% |
Sanity QA
Evaluation Scores: 60.0%, 80.0%
Step 1: Sum of scores = 60.0 + 80.0 = 140.0
Step 2: Number of evaluations = 2
Step 3: Average Score = 140.0 ÷ 2 = 70.0%
Xavior
Evaluation Scores: 75.0%, 50.0%
Step 1: Sum of scores = 75.0 + 50.0 = 125.0
Step 2: Number of evaluations = 2
Step 3: Average Score = 125.0 ÷ 2 = 62.5%
Vijay
Evaluation Scores: 70.0%, 60.0%
Step 1: Sum of scores = 70.0 + 60.0 = 130.0
Step 2: Number of evaluations = 2
Step 3: Average Score = 130.0 ÷ 2 = 65.0%
Individual Average Scores:
Sanity QA: 70.0%
Xavior: 62.5%
Vijay: 65.0%
Sum of scores: 70.0+62.5+65.0=197.5
Number of evaluations: 6
197.5 Sum of scores / 3 agents = 65.83% average score of all three agents: Sanity QA, Xavior, and Vijay.
To calculate the score of average of values:
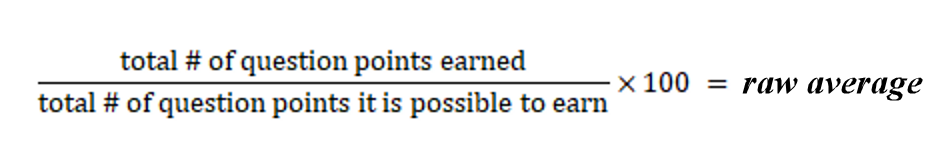
Step-by-step calculation of the average of values for each agent based on two evaluations:
Sanity QA - 3 by 5, 8 by 10
Total points earned = 3 + 8 = 11
Total points possible for all evaluations = 5 + 10 = 15
Average raw score will be = 11 /15 x 100 = 73.3333
Xavior - 3 by 4, 5 by 10
Total points earned = 3 + 5 = 8
Total points possible for all evaluations = 4 + 10 = 14
Average raw score will be = 8 /14 x 100 = 57.1429
Vijay - 3 by 3, 3 by 10
Total points earned = 3 + 3 = 6
Total points possible for all evaluations = 3 + 10 = 13
Average raw score will be = 6 /13 x 100 = 46.1538
Maximum points earned 3 + 8 + 5 + 3 + 3 + 3 / 5 + 10 + 4 + 10 + 3 + 10 Maximum points possible x 100 = Overall team score
= 25 / 42 x 100 = 0.5952
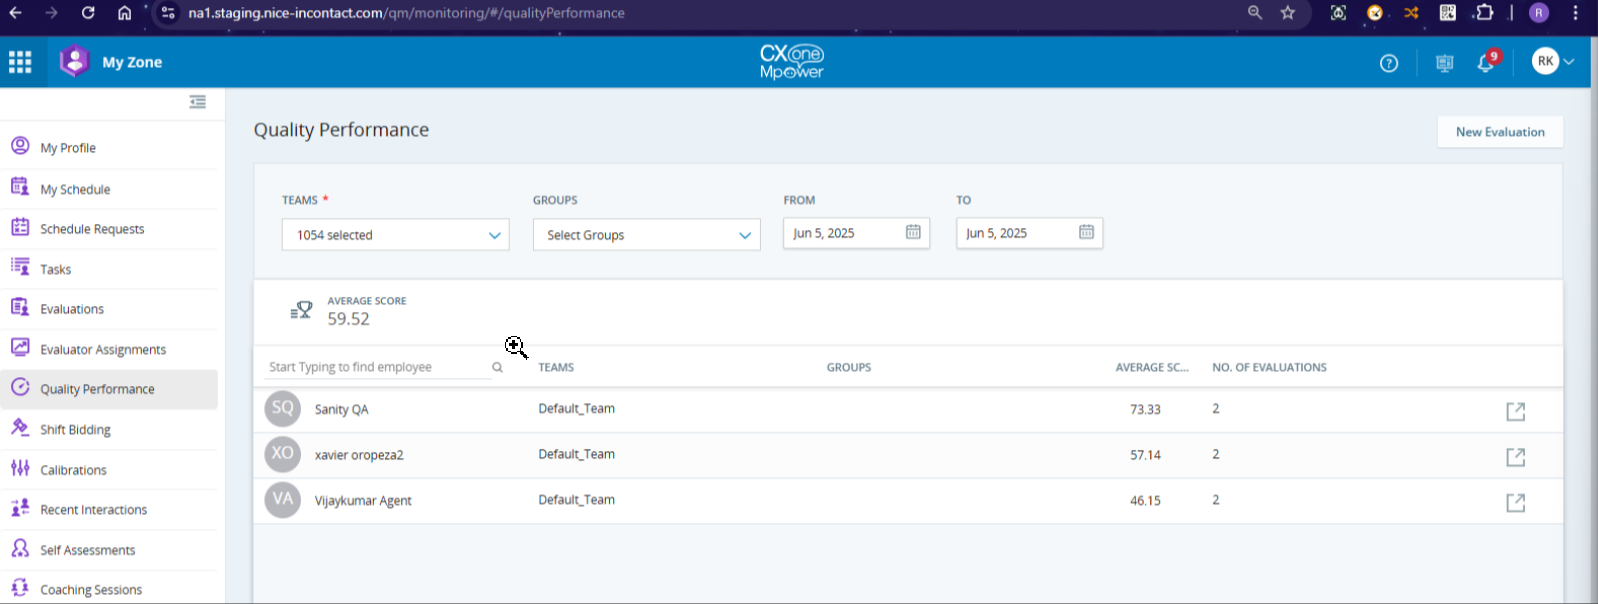
By default, Prebuilt Reports and Quality Management (CXone) widgets on the Dashboard use the Average of values formula.
Depending on the license, QM offers additional capabilities:
QM Advanced provides you with further insights into agent performance using categories to analyze all your voice and text interactions. Those insights enhance coaching effectiveness and quality assurance processes.
QM Premium provides you with further insights into agent behavior metrics by providing the behavior performance indicators for all interactions. Those insights enhance coaching effectiveness and quality assurance processes.
Here's a quick workflow to help you get started.
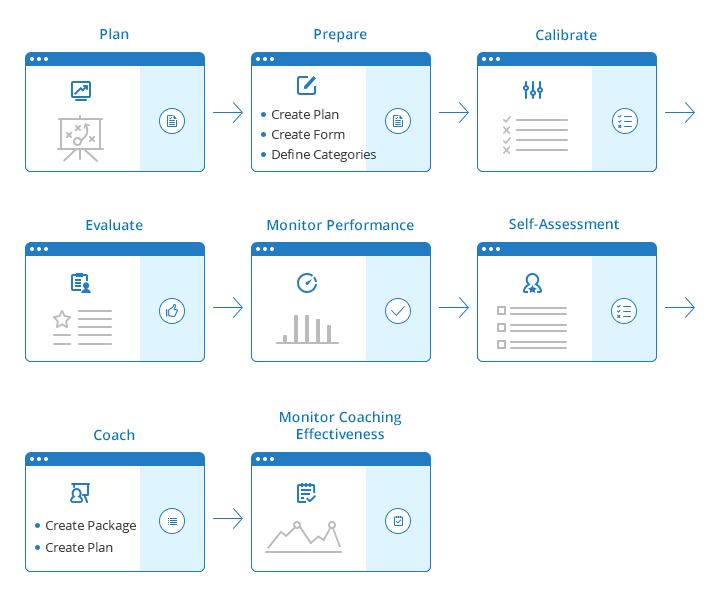
Defining categories is only available for users with Quality Management (CXone) Advanced.
To learn more about Quality Management Advanced, see the NiCE CXone QM Advanced Overview on this page.
NiCE CXone Quality Management (CXone) for CRM Ticketing
NiCE CXone Quality Management (CXone) for CRM Ticketing provides a Ticket Search feature that allows you to search exclusively for tickets, making it easier and faster to find the information you need.
Once a ticket is updated to resolved or closed status, it appears on the Ticket Search page. You can view all interactions related to the ticket along with agent and system generated comments within the ticket, enhancing your ability to track and manage your tickets efficiently.
For more information. See Calibrating an Evaluation of a Ticket.
For more information. See Evaluating a Ticket.
For more information. See MyZone for QM Ticket Evaluators.
For more information. See Quality Planner for Tickets.